Turbine Performance Test |
 
|
Turbine Performance Test |
|
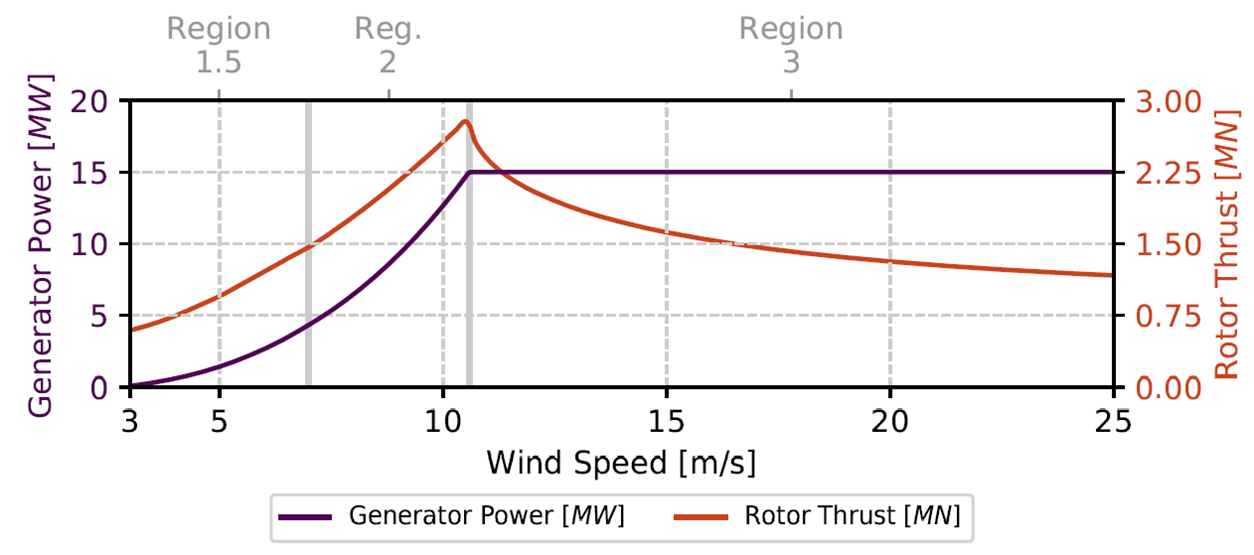
This section examines fundamental turbine performance characteristics as a function of wind speed. The following figures are taken from the published report on the IEA Wind 15 MW reference wind turbine (Gaertner et al. 2020). The graphs present the steady-state performance of the turbine as a function of wind speed, including key variables such as rotor thrust, rotor speed, tip speed ratio, generator torque, blade pitch and generator power. The performance of the turbine is governed by the NREL ROSCO controller as discussed in the introduction.
") Controller Regulation (Gaertner et al. 2020) |
|
The following sub-sections compare results obtained from Flexcom and OpenFAST numerical models. For modelling simplicity, this section considers the turbine and supporting tower only, without the floating platform and mooring system. Two separate Flexcom blade models are included:
•Rigid blades - a simplified model in which the blade geometries are approximated as rigid profiles, so any variations in aerodynamic loading due to dynamic blade deformations are not captured. Blade rotational inertia is neglected as the blades are massless.
•Flexible blades - a more accurate model in which the rotating blades are modelled explicitly using beam elements, capturing local blade deformations and their effects on aerodynamic loads. Blade rotational inertia is automatically included.
The OpenFAST models were built using the ElastoDyn module, whereas Flexcom 's (flexible blade) model uses its standard beam-column elements. It is possible that closer agreement may have been achieved had a combination of the ElastoDyn and BeamDyn modules been used.
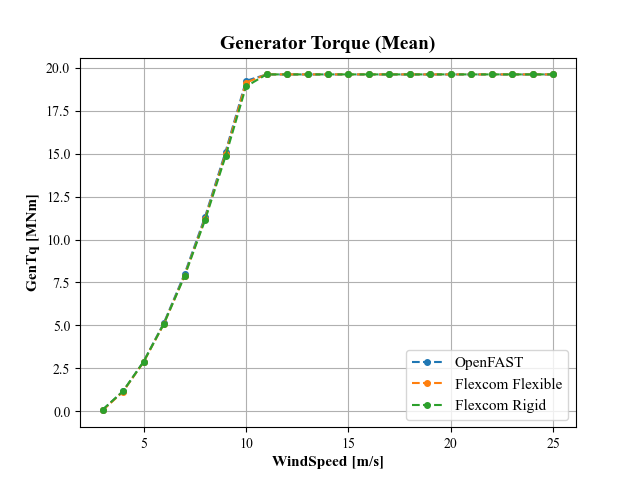
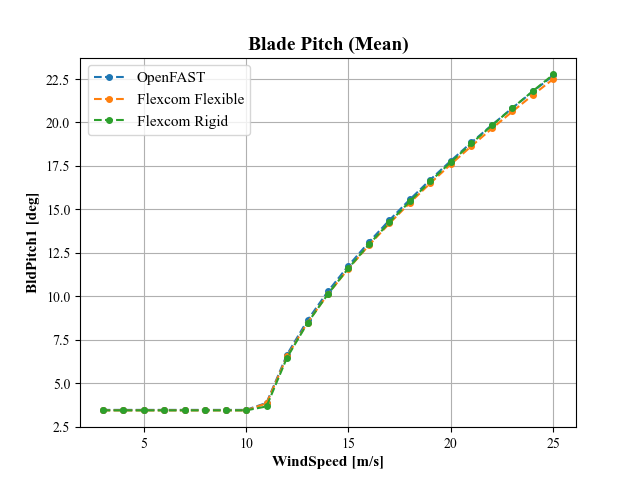
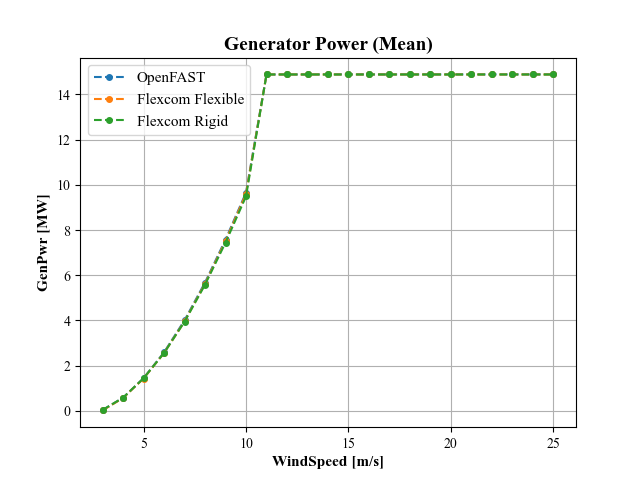
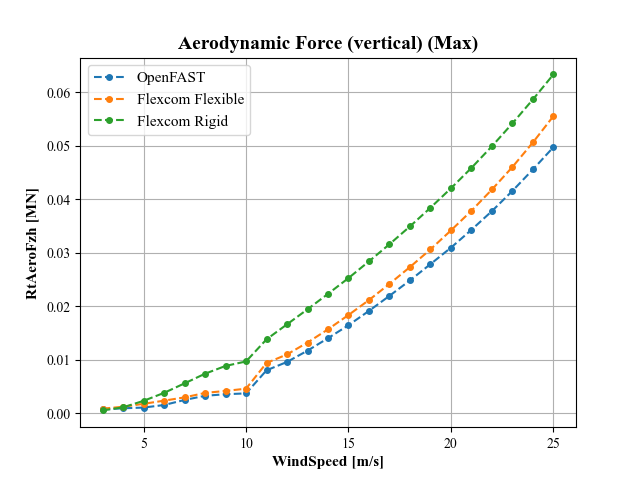
Most parameters such as rotor thrust, rotor speed, generator power etc. are presented as steady-state mean values. Some parameters which change sign as the blades rotate, such as aerodynamic force in the side-to-side direction, as presented in terms of absolute maximum values. The use of mean or maximum values is noted in the title of each chart.
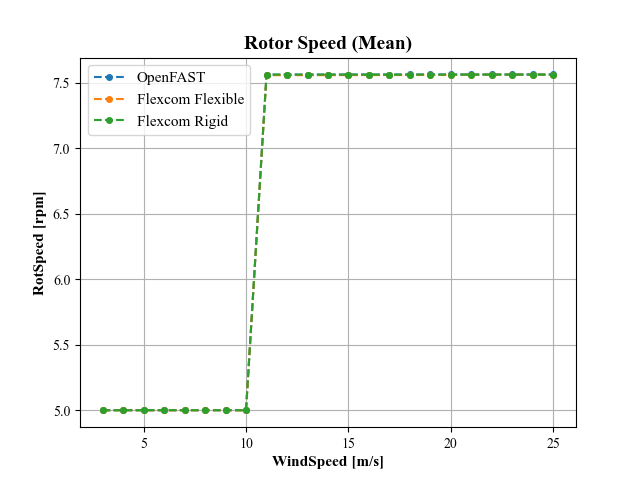
This section presents the key turbine performance metrics as predicted by the numerical models. All plots show excellent agreement between OpenFAST and Flexcom.
|
|
|
|
|
|
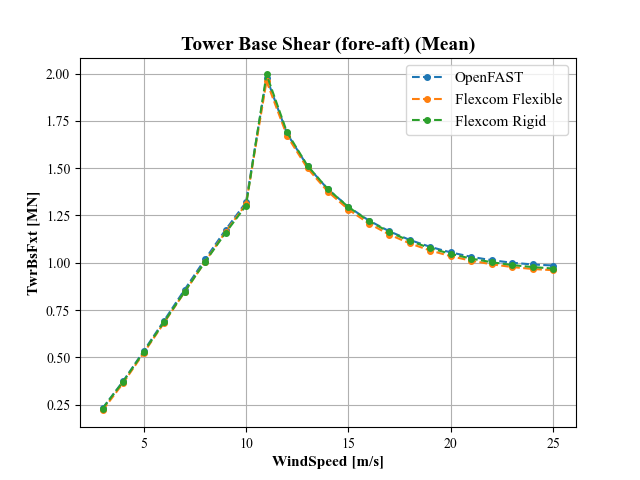
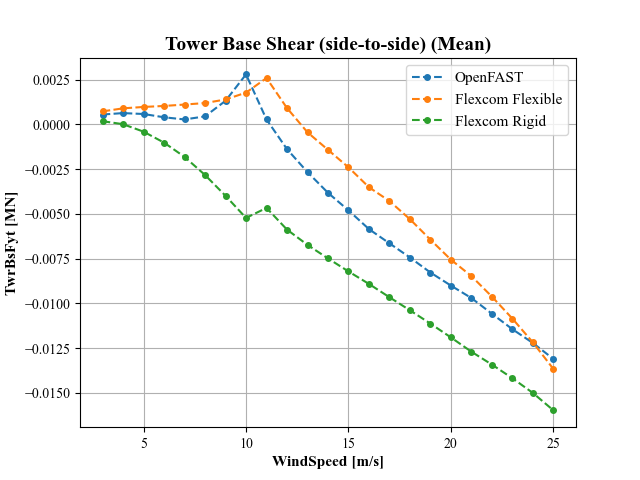
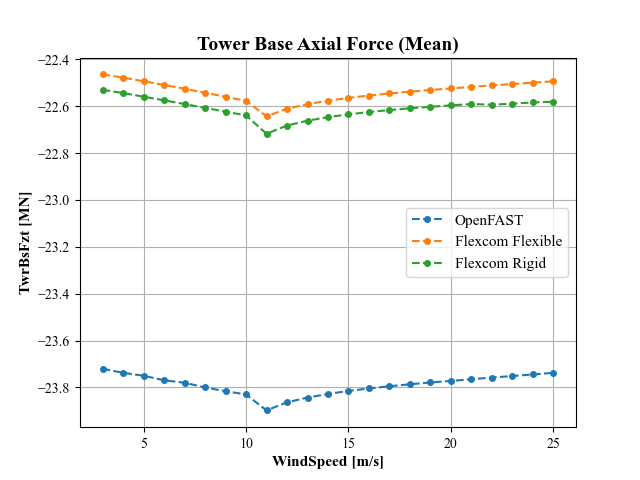
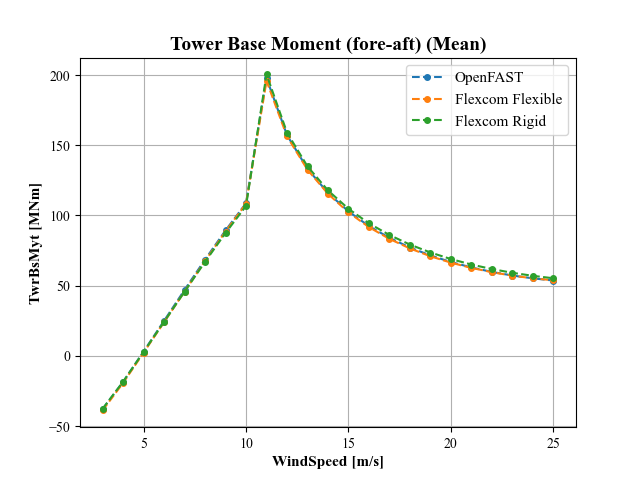
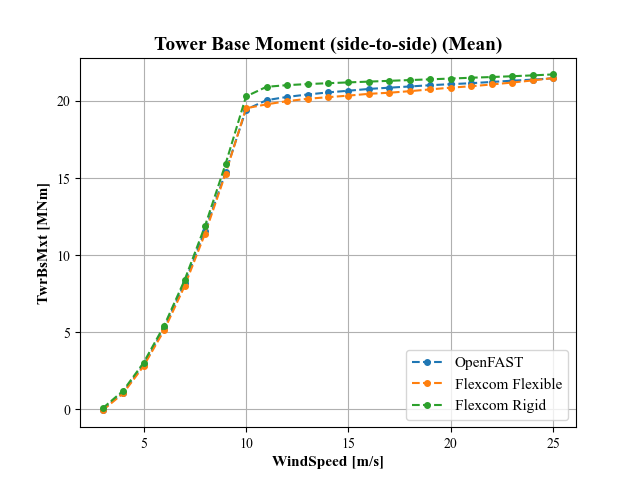
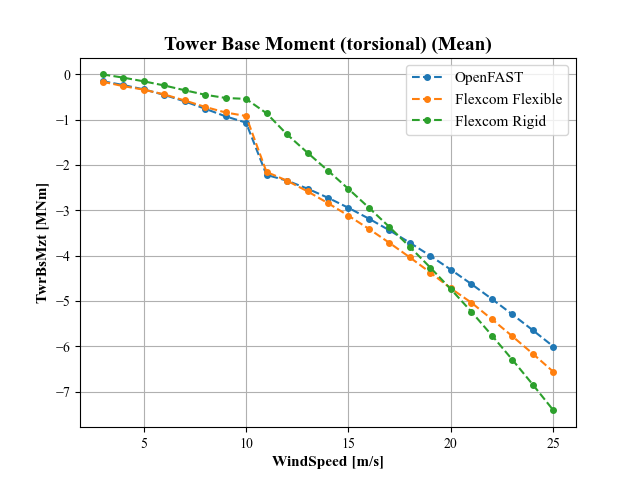
This section presents forces and moments experienced by the tower, as predicted by the numerical models.
•Fore-Aft. Shear force and bending moment at the tower base show excellent agreement between OpenFAST and Flexcom. These are typically the dominant loads which drive the structural design of the tower.
•Side-to-Side. Shear force shows some discrepancy between OpenFAST and Flexcom, stemming from slight discrepancies in the lateral aerodynamic forces. Note that the side-to-side shear is not significant as it is 100 times smaller than the fore-aft shear. Tower base bending moment shows good agreement.
•Vertical. The compressive force at the tower base predicted by Flexcom is 5% lower than that of OpenFAST. This force is caused by the self-weight of the tower and turbine and is unrelated to aerodynamic loading (the force is almost independent of wind speed). It is likely that the Flexcom model is missing a weight component which is present in the OpenFAST model i.e. it is just a model calibration issue. Tower base torsional moment shows good agreement between OpenFAST and Flexcom, particularly for the flexible blade model.
|
|
|
|
|
|
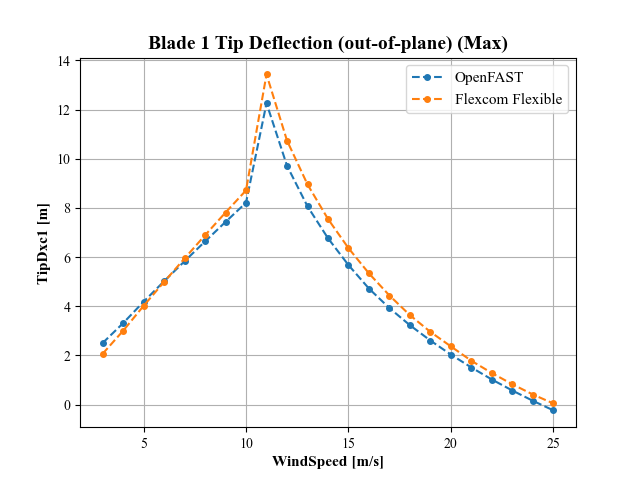
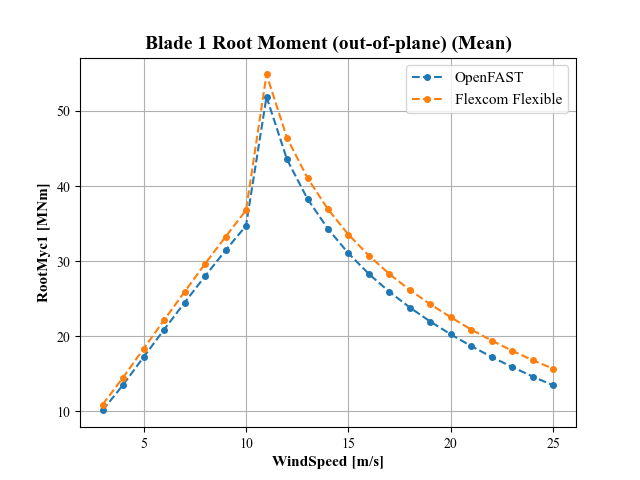
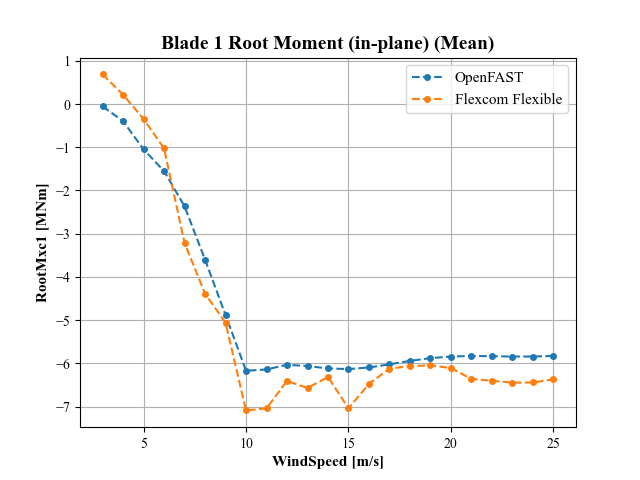
This section presents the blade structural response parameters, as predicted by the numerical models.
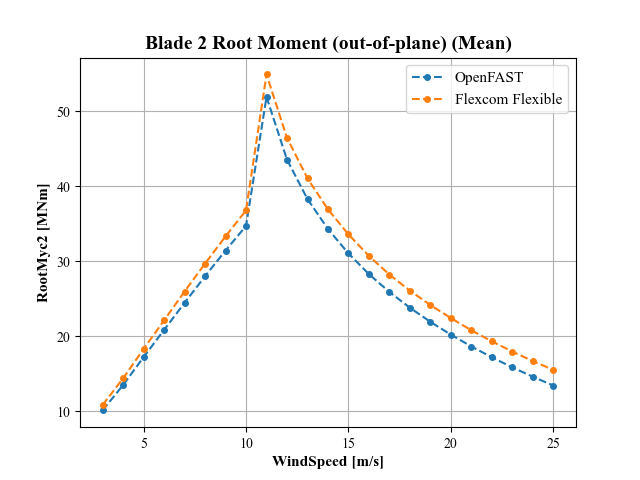
•Out-of-Plane. Flexcom and OpenFAST show good agreement for out-of-plane blade tip deflections. Note that the Flexcom deflections are reported with respect to the initial blade location including pre-cone, while the OpenFAST deflections are reported with respect to the rotor plane, and this may account for some of the minor discrepancies in results. The out-of-plane bending moments at the blade roots also show close agreement, even though the OpenFAST model is based on ElastoDyn rather than a combination of ElastoDyn and BeamDyn.
•In-Plane. In-plane bending moments at the blade roots also show good agreement, although these are an order of magnitude lower than the out-of-plane moments. Flexcom does not yet have the ability to present in-plane deflections, this feature will be added in a later release.
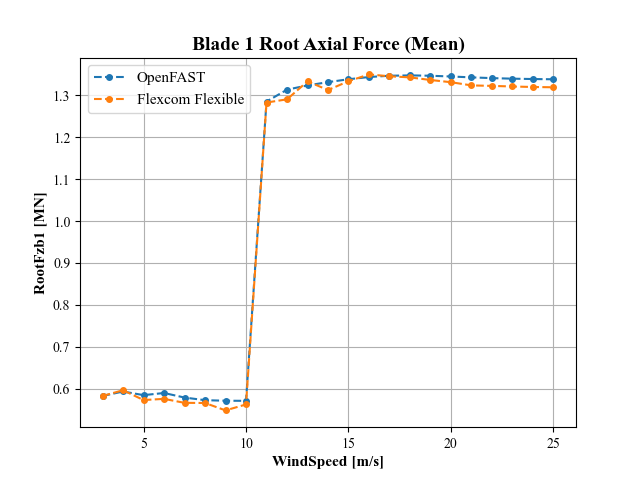
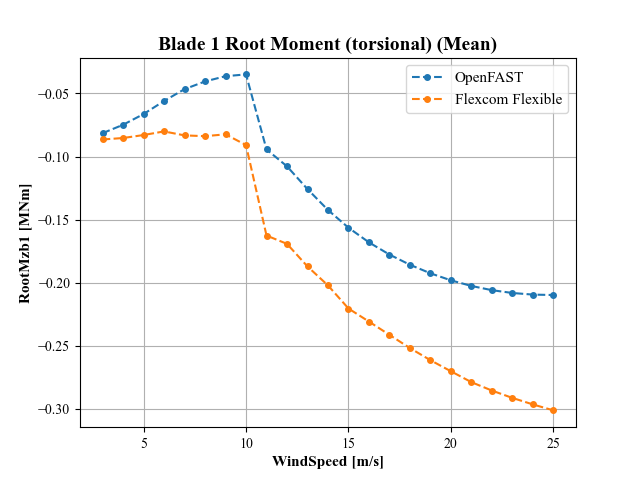
•Axial and Torsional. Axial force at the blade root, which is related to rotor speed, shows close agreement between Flexcom and OpenFAST. Some discrepancies are evident for torsional moment but the overall magnitudes are small.
|
|
|
|
|
|
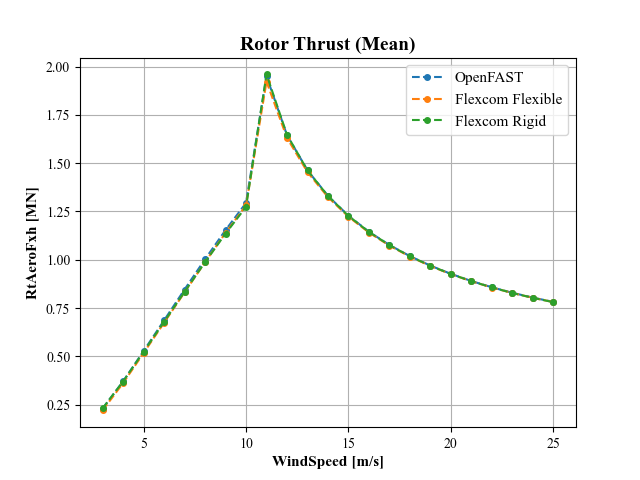
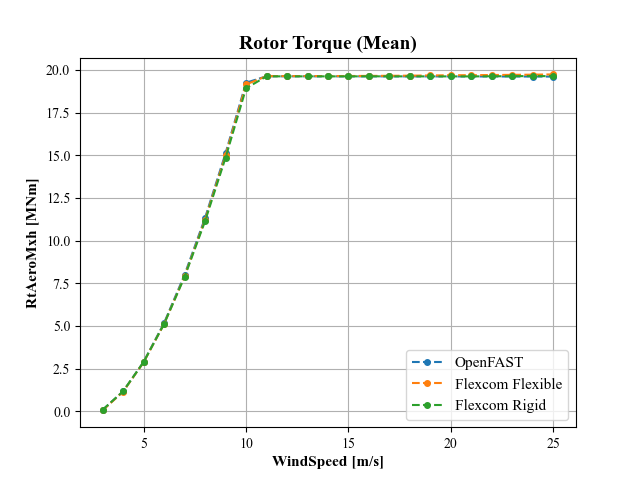
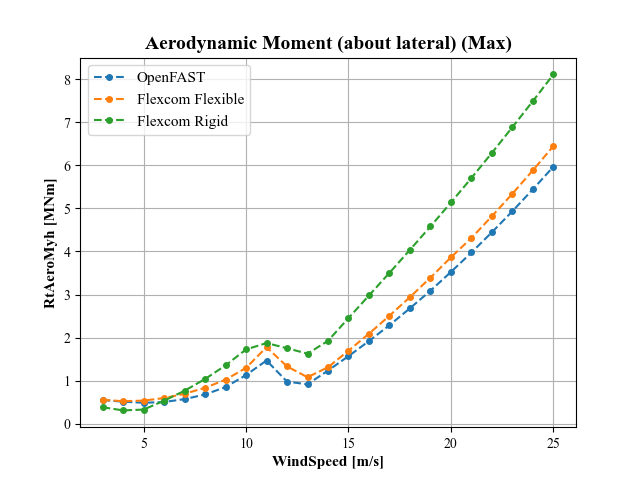
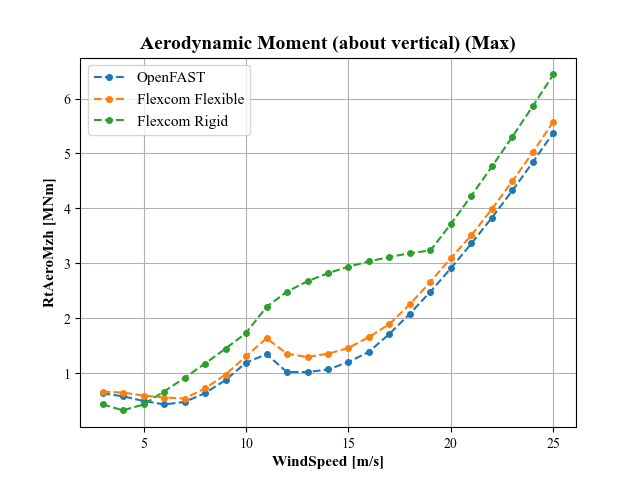
Although rotor thrust and torque were already presented already in Turbine Performance above, this section presents the aerodynamic loads in all 6 degrees of freedom for completeness.
•Rotor thrust and rotor torque, the dominant loads, show excellent agreement.
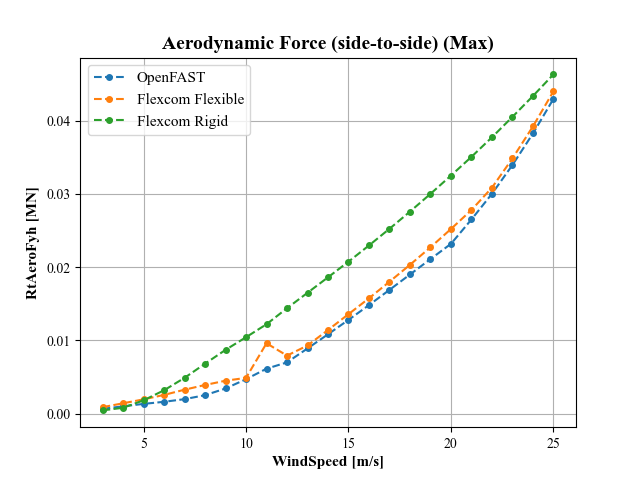
•Aerodynamic forces in the side-to-side and vertical directions show good agreement between Flexcom's flexible blade model and OpenFAST. Some minor discrepancies are evident for the Flexcom's rigid blade model. Forces in these directions are not very significant as they are 40 times smaller than the windward loads.
•Good agreement is also shown for the pitch (fore-aft) and yaw (torsional) aerodynamic moments, particularly between Flexcom's flexible blade model and OpenFAST.
|
|
|
|
|
|
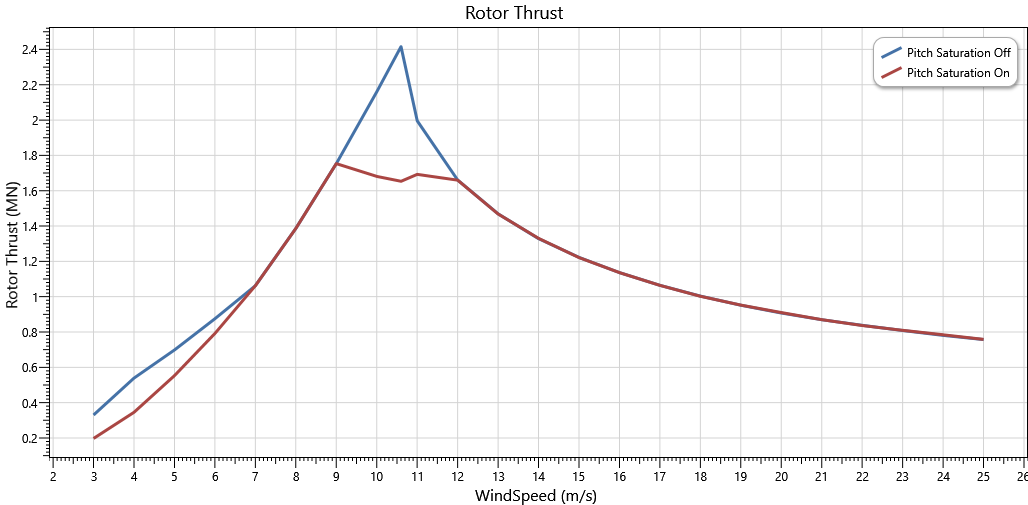
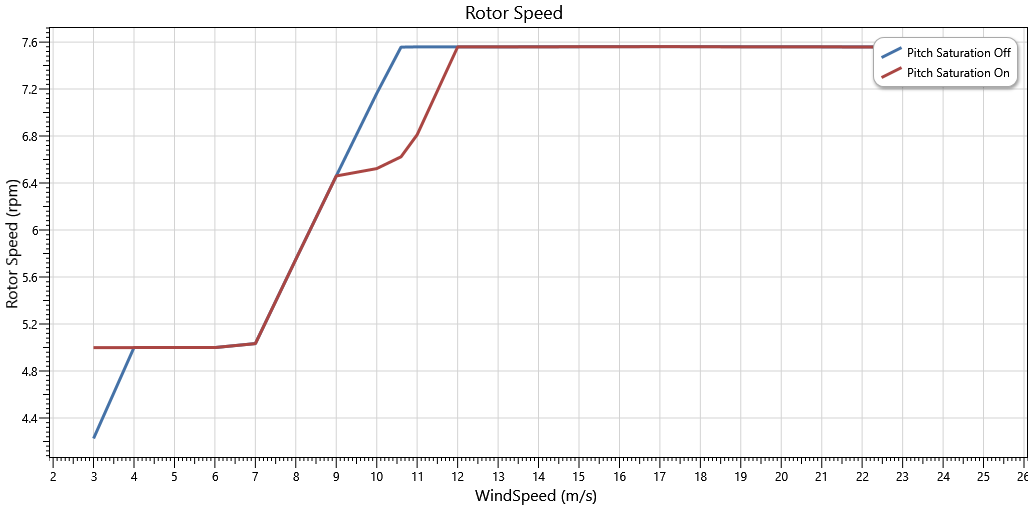
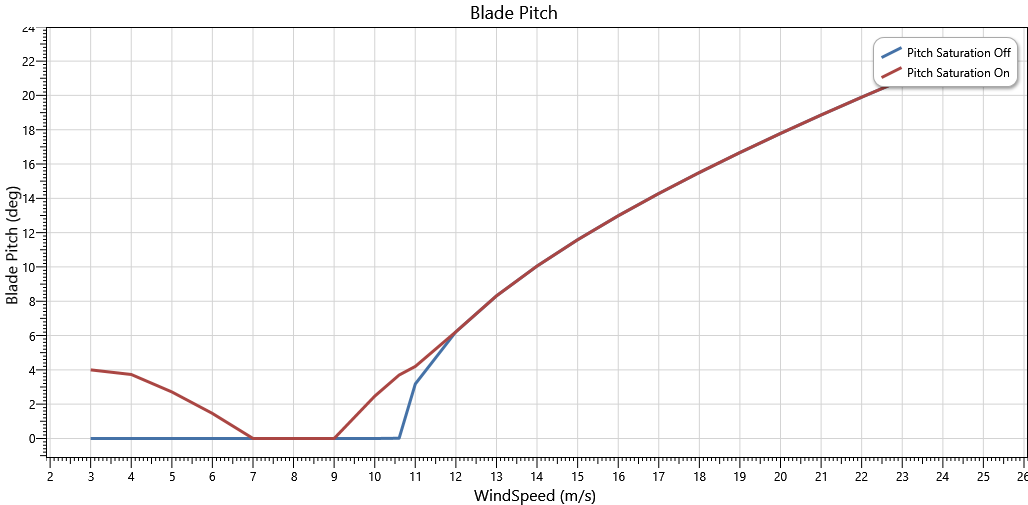
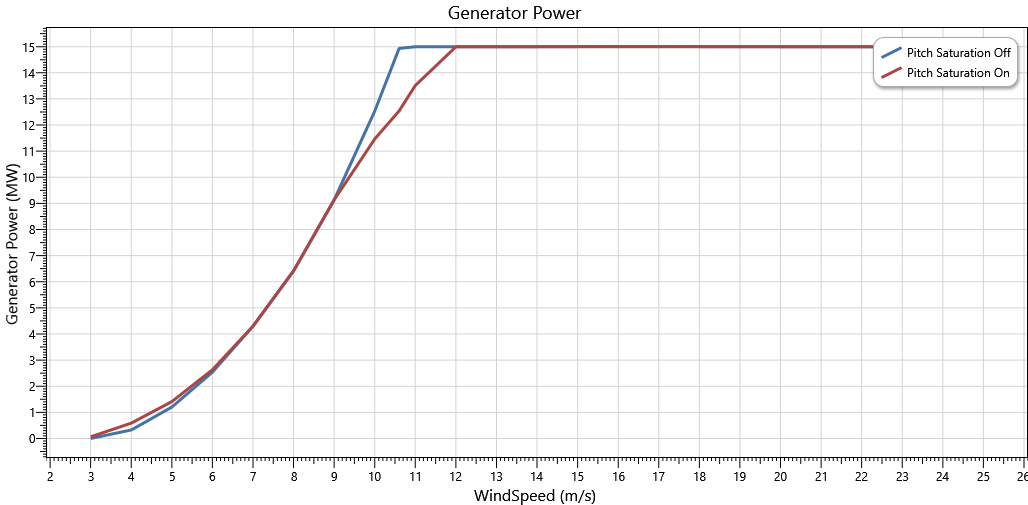
When you run the turbine performance test shipped with Flexcom, you may notice that the turbine performance parameters (e.g. rotor thrust, generator power etc.) show some discrepancies with the IEA published report. By default, the Flexcom model uses the same controller settings as contained in the OpenFAST model of the IEA turbine supplied by NREL, and this control model includes minimum pitch saturation. You can easily switch off pitch saturation by editing the controller data file ('DISCON-UMaineSemi.IN', found in the ServoDyn subfolder of the example) and switching the PS_Mode variable from 1 to 0. When pitch saturation is off, results from the Flexcom turbine performance test align well with the published data.
Pitch saturation helps (i) to limit the rotor thrust through a peak shaving algorithm and (ii) to maximise power at low wind speeds. The ROSCO controller allows you to define a minimum blade pitch angle for a given wind speed via a lookup table in the controller data file. The following figures present turbine response as a function of wind speed with and without pitch saturation so you can clearly see the difference in turbine performance. Peak shaving algorithms implemented with minimum pitch saturation can result in power losses because the turbine does not operate at its highest efficiency at wind speeds close to rated. Hence there is a balance to be struck between power maximisation and structural load reduction. Refer to Abbas et. al, 2022 for further background information on the controller tuning and implementation methods.
|
|
|
|