Summary Collation Plot |
 
|
Summary Collation Plot |
|
The overall operation of the summary collation feature was outlined already, but a brief synopsis is useful at this point.
•Firstly, you explicitly request the creation of summary output from the individual simulations, achieved via the inclusion of the relevant $SUMMARY POSTPROCESSING keywords. After a simulation has completed, Flexcom stores the relevant data in Summary Database Files.
•Secondly, you define one or more key parameters which uniquely identify each individual simulation within a load case matrix. Identifiers are explicitly defined via the *COLLATE PLOT AXES keyword.
•Thirdly, you request the collation of parameters of interest across the entire load matrix (or a subset of it). The $SUMMARY COLLATE section contains a number of relevant keywords, such as *IDENTIFY which nominates the folders of interest on your hard drive.
•In addition to a Summary Collation Spreadsheet, it also possible to request the creation of Summary Collation Plots, via the *PLOT keyword, for enhanced data visualisation. Specifically, you can plot the variation of any summary postprocessing output against any key driving parameters. For example, you can plot maximum effective tension as a function of both wave period and incident wave heading in a 3-dimensional space.
Summary collation plots are typically 3-dimensional, based on the following axes.
•The relevant output variable is plotted on the vertical axis. Depending on the required statistical measurement, the meaning/scale on the vertical axis can vary. Typically the maximum value attained is presented as this is usually of greatest interest. However, it is possible to examine minimum, mean, range or deviation also.
•The first key driving parameter is plotted on the primary horizontal axis.
•The second key driving parameter is plotted on the secondary horizontal axis. This parameter is optional, and a 2D Plot will be created if it is omitted.
The following sample plot presents maximum effective tension (kN) as a function of both wave period (s) and incident wave heading (degrees).
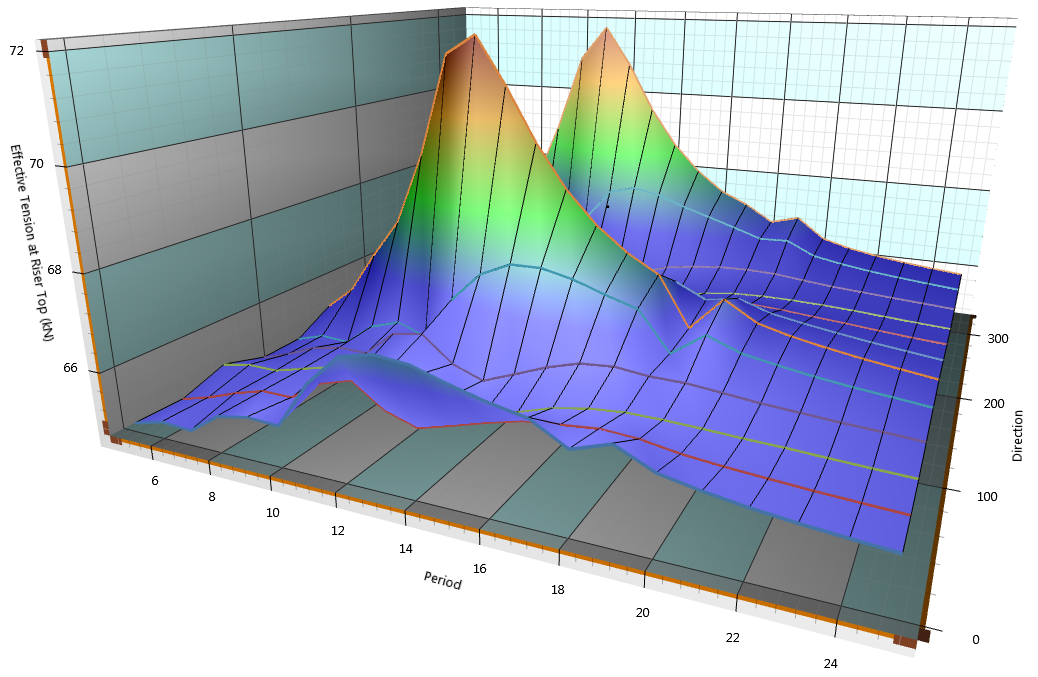
Sample Summary Collation Plot
•*IDENTIFY is used to identify output files for inclusion in summary postprocessing collation.
•*PLOT is used to request the creation of a summary collation plot which graphically presents the variation of any summary postprocessing output against key driving parameters.
•*COLLATE is used to specify the summary postprocessing data to be collated and any exclusion criteria. *COLLATE is used to specify the summary postprocessing data to be collated and any exclusion criteria. This keyword is optional, and if you do not explicitly designate certain parameters for collation purposes, Flexcom will attempt to collate all available data.