2D Plots |
 
|
2D Plots |
|
2D plots are the most common in Flexcom. One (dependent) variable is plotted against another (independent) variable in a 2-dimensional space. In the vast majority of cases, the independent variable (typically plotted on the horizontal axis) is one of the following:
•Element set length (in metres or feet)
•Time (in seconds)
•Frequency (in Hertz)
2D plots are ideally suited to the type of output produced during Database Postprocessing and Summary Postprocessing, the two main sources of output data from Flexcom. Sample outputs include...
•Timetrace: a plot of the variation of a particular parameter as a function of time
•Snapshot: a plot of the spatial distribution of a particular parameter at a given time
•Statistics: a plot of the statistical variation of a particular parameter over the course of an analysis. Options include maximum/minimum envelopes, mean values, standard deviations and extreme values.
•Spectrum: a plot of the spectral distribution of a particular parameter
The following is a statistical plot of effective tension (kN) plotted as a function of length along a structure (m).
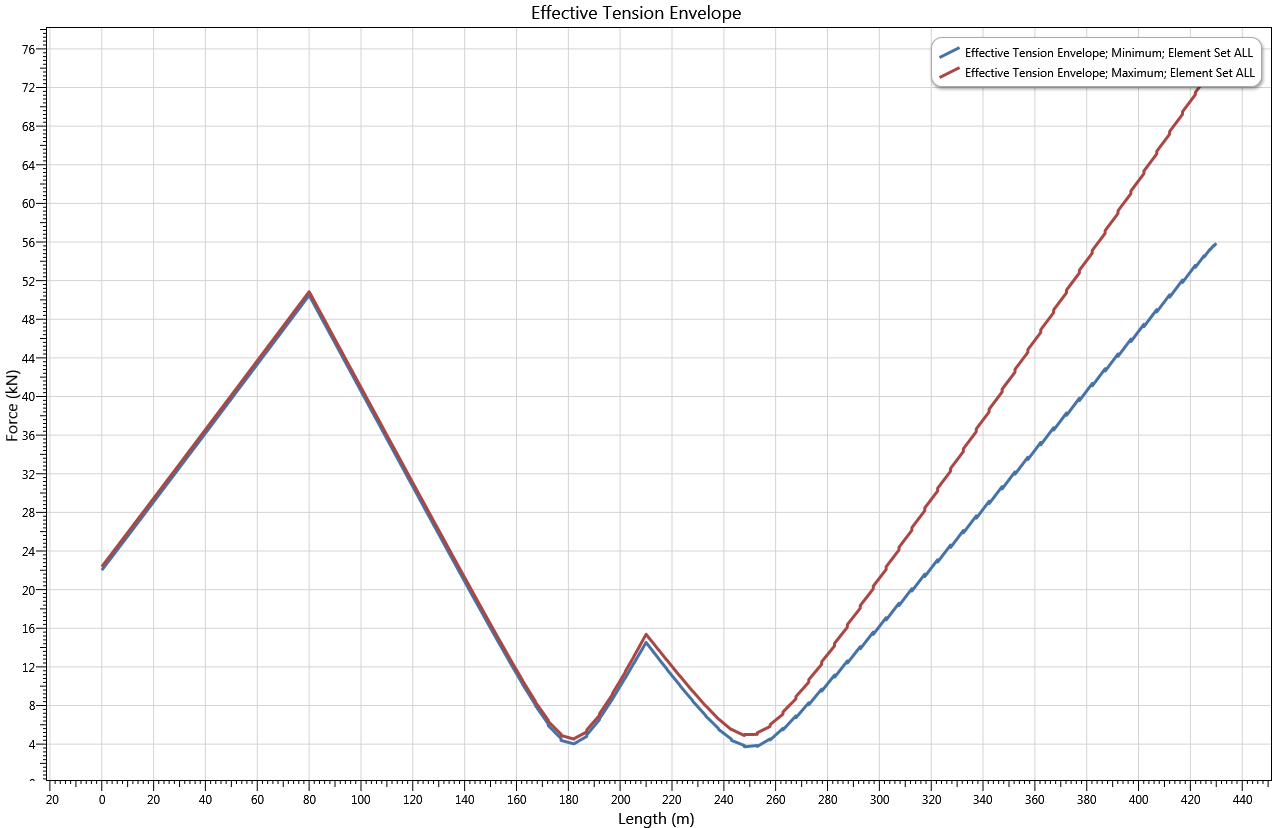
Sample 2D Plot
The toolbar at the top of the Plotting facility provides useful options for customising plots, including exporting to Excel, manipulating title, axis and legend entries, viewing data tooltips etc. Refer to Plotting Toolbar for a full list of all the relevant commands.
The quickest and easiest option for zoom control is to use the Mouse Scroll Wheel. Rolling the wheel upwards zooms in, while rolling downwards zooms out.
You can also hold the CTRL key while dragging the mouse, allowing you to select a particular zoom area. If you hold the SHIFT key while dragging the mouse, the zoomed area will maintain the same aspect ratio of the current plot.
An individual axes can be zoomed by hovering over the relevant axis and using the Mouse Scroll Wheel. In this case the other axis remains unchanged. An axis can be also stretched by holding the Right Mouse Button and moving the mouse (up and down for the vertical axis, left and right for the horizontal axis). The mouse cursor also indicates the direction to move the mouse in order to stretch or shrink the displayed range. The axes can also be moved by holding the Left Mouse Button and moving the mouse accordingly.