3D Plots |
 
|
3D Plots |
|
3D plotting is an advanced feature which provides enhanced visualisation of engineering data. One (dependent) variable is plotted against two other (independent) variables in a 3-dimensional space. The plot control is fully interactive, and you can pan, zoom and rotate the viewpoint for ease of inspection. Helpful tooltips allow you to retrieve exact data and any point in the 3D space. It’s also possible to switch back to planar/2D views should you prefer.
3D plots are a relatively recent addition to Flexcom. These plots are ideally suited to the examination of vessel RAO data (refer to the Vessel Response Plot feature) but more importantly to summary postprocessing and collation. If you are performing a series of analyses (for example to examine a large number of different load cases), the summary collation facility provides a useful means of assembling all the pertinent summary data across a range of load cases into a single Summary Collation Spreadsheet. Enhanced data visualisation is also provided by the ability to produce 3-dimensional Summary Collation Plots. Here you can plot the variation of any summary postprocessing output against any key driving parameters. For example, you can plot maximum effective tension as a function of both wave period and incident wave heading in a 3-dimensional space.
The toolbar at the top of the Plotting facility provides useful options for customising plots, including exporting to Excel, manipulating title, axis and legend entries, viewing data tooltips etc. Refer to Plotting Toolbar for a full list of all the relevant commands.
The following sample plot presents maximum effective tension (kN) as a function of both wave period (s) and incident wave heading (degrees).
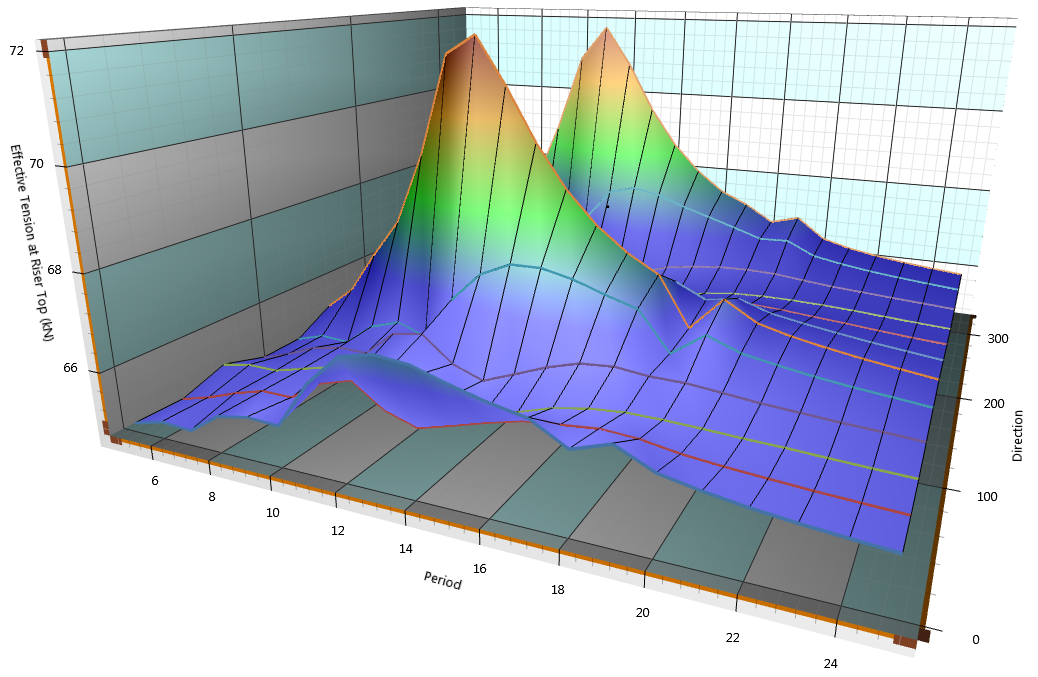
Sample Summary Collation Plot