Summary Collation Spreadsheet |
 
|
Summary Collation Spreadsheet |
|
For every parameter which is collated (i.e. based on the descriptive titles assigned to various outputs during the creation of the Summary Output File for each individual analysis), a summary table is presented with the following headings:
•Analysis Title
•Maximum value, and corresponding time of occurrence
•Minimum value, and corresponding time of occurrence
•Mean value
•Range
•Standard deviation
•Simulation status (successful analysis, unconverged solution, solution indeterminacy etc.)
•Filename and path of Summary Database File
The table below shows a sample extract from a summary collation file. Based on a coupled analysis from the standard Flexcom examples set, it summaries the heave motions of a CALM buoy for a range of applied regular wave loading.

Sample List of Collation Parameters
Towards the end of the spreadsheet, a useful summary of extreme values is also presented. For every parameter which is collated, this section highlights the most critical analyses in the load case matrix, both in terms of greatest maxima and greatest minima attained. For example, the largest heave motions of the CALM buoy occur for a wave period of 7s, and this is readily evident from the summary data.
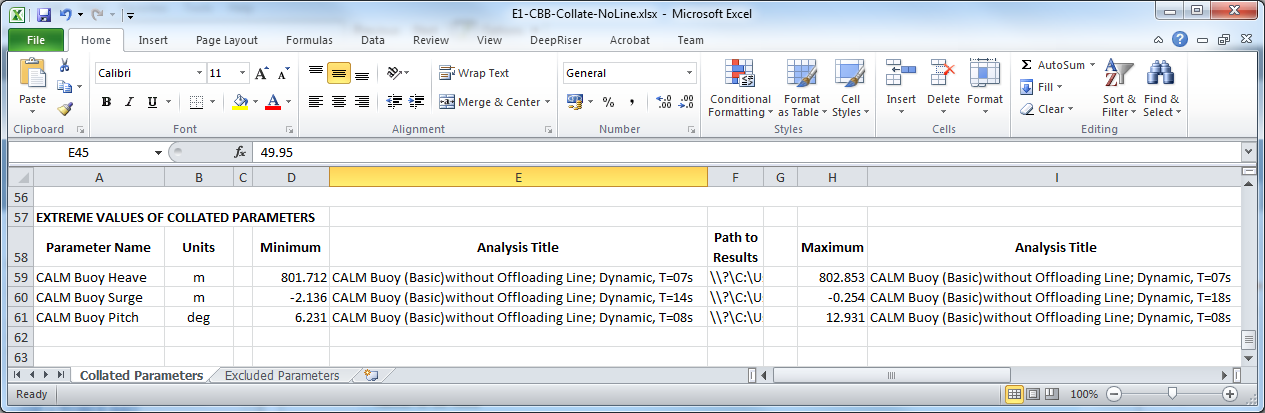
Extreme Values of Collation Parameters
Relevant Keywords
•*IDENTIFY is used to identify output files for inclusion in summary postprocessing collation.
•*COLLATE is used to specify the summary postprocessing data to be collated and any exclusion criteria. This keyword is optional, and if you do not explicitly designate certain parameters for collation purposes, Flexcom will attempt to collate all available data.