Collation |
 
|
Collation |
|
If you are performing a series of analyses (for example to examine a large number of different load cases), the Summary Postprocessing Collation facility provides a useful means of assembling all the pertinent summary data across a range of load cases into a single Summary Collation Spreadsheet. Enhanced data visualisation is also provided by the ability to produce 3-dimensional Summary Collation Plots. You can plot the variation of any summary postprocessing output against any key driving parameters. For example, you can plot maximum effective tension as a function of both wave period and incident wave heading in a 3-dimensional space.
In this example, the following information is specified to govern the collation process.
•Four different parameters are explicitly requested for inclusion in the collation process. Strictly speaking, this is not absolutely necessary, as Flexcom will simply collate all available data in the absence of specific guidance. However, inclusion of this information allows you to assign custom units to the collated parameters.
•All sub-folders of the current working directory are designated for inclusion in the collation process.
•Four separate 3D plots are requested, corresponding to the output parameters which were already requested as part of the individual simulations.
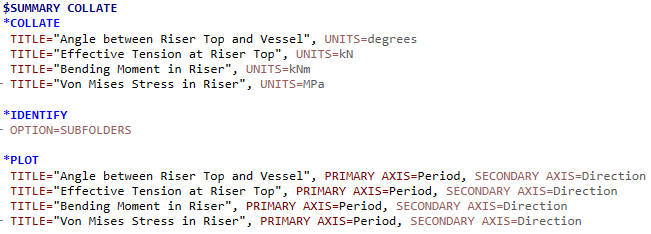
Summary Collation Requests
•*COLLATE is used to specify the summary postprocessing data to be collated and any exclusion criteria. This keyword is optional, and if you do not explicitly designate certain parameters for collation purposes, Flexcom will attempt to collate all available data.
•*IDENTIFY is used to identify output files for inclusion in summary postprocessing collation.
•*PLOT is used to request the creation of a Summary Collation Plot which graphically presents the variation of any summary postprocessing output against key driving parameters.