Spreadsheet Output |
 
|
Spreadsheet Output |
|
The collation facility provides a useful means of assembling all the pertinent summary data across a range of load cases into a single Summary Collation Spreadsheet. This spreadsheet contains a table of data listing the parameters of interest from all of the individual simulations, including maximum, minimum and mean values, range and standard deviation.
Towards the end of the spreadsheet, a useful summary of extreme values is also presented. For every parameter which is collated, this section highlights the most critical analyses in the load case matrix, both in terms of greatest maxima and greatest minima attained.
The extreme values of the collated parameters across all the individual simulations are presented as shown below. The most critical wave direction is 150 degrees, as all the parameters considered attain their maximum values at this direction. The most critical wave period appears to be in the region of 18s-19s where both bending moment and von Mises stress reach maximum values.
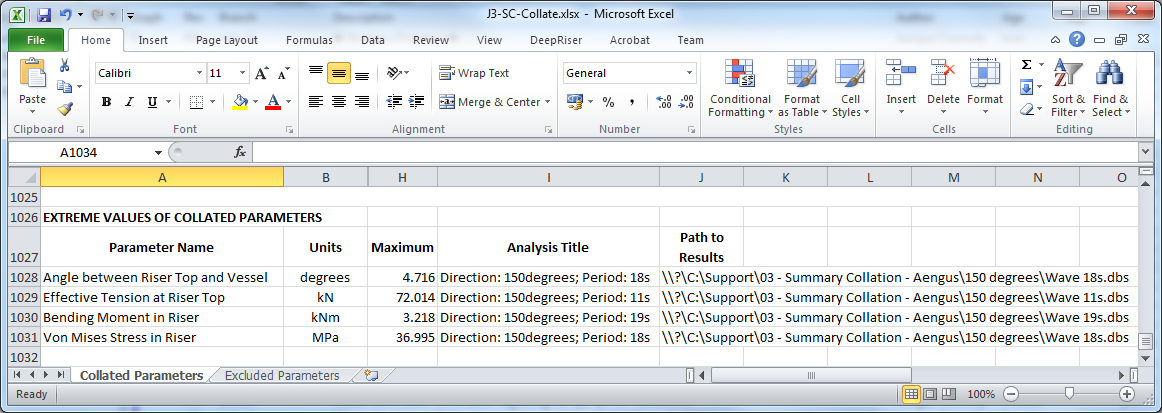
Summary of Extreme Values