3D Plots |
 
|
3D Plots |
|
Once all the individual simulations have been completed, you can plot the variation of any output against key driving parameters using a 3-dimensional Summary Collation Plot.
Four separate 3D plots are created in this example, corresponding to the output parameters which were already requested as part of the individual simulations. Wave period and wave direction are plotted on the horizontal axes.
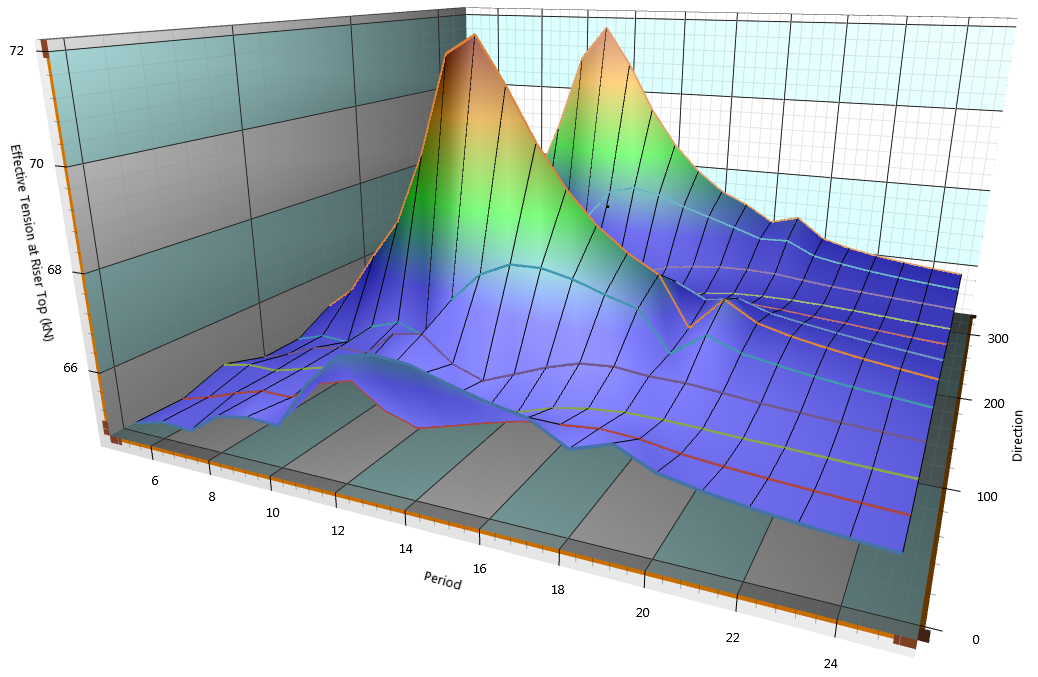
Maximum Effective Tension at Riser Top
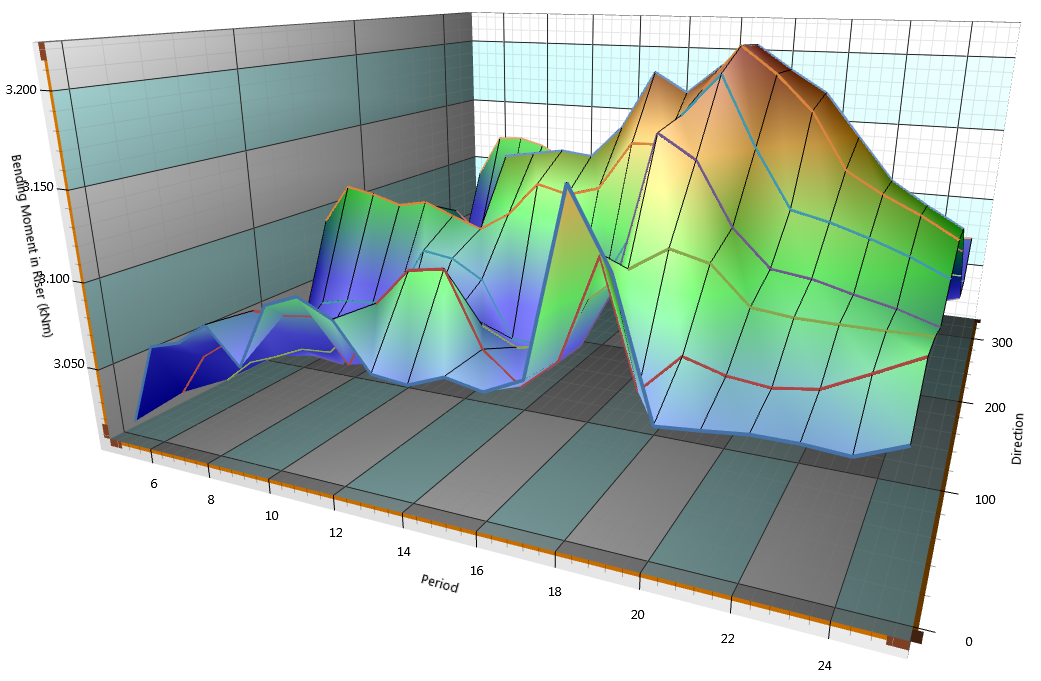
Maximum Bending Moment in Riser
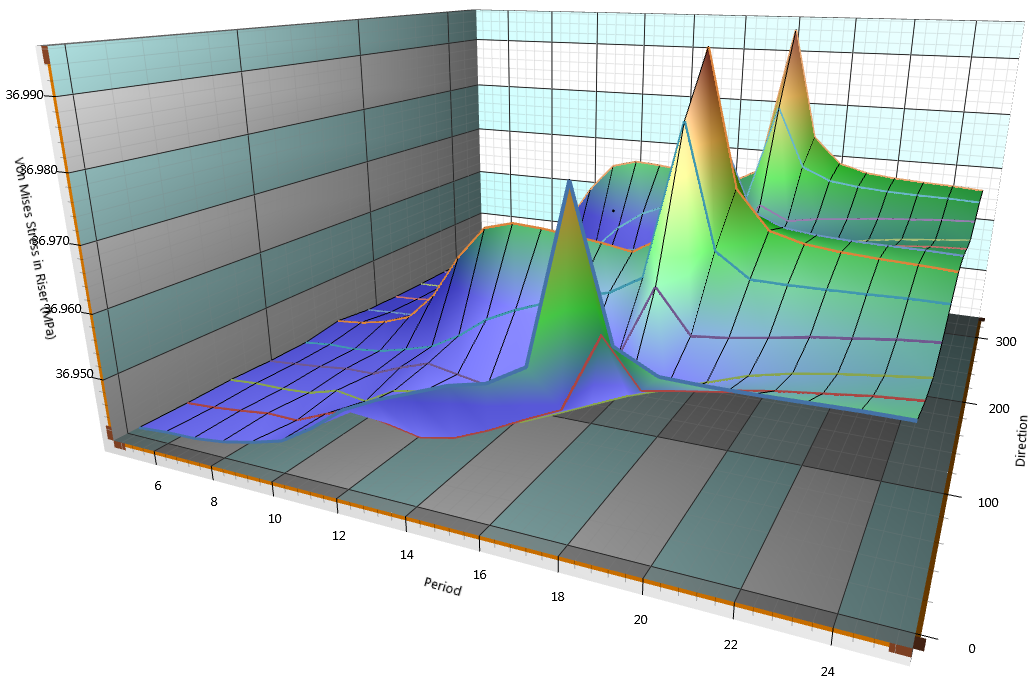
Maximum Von Mises stress in Riser
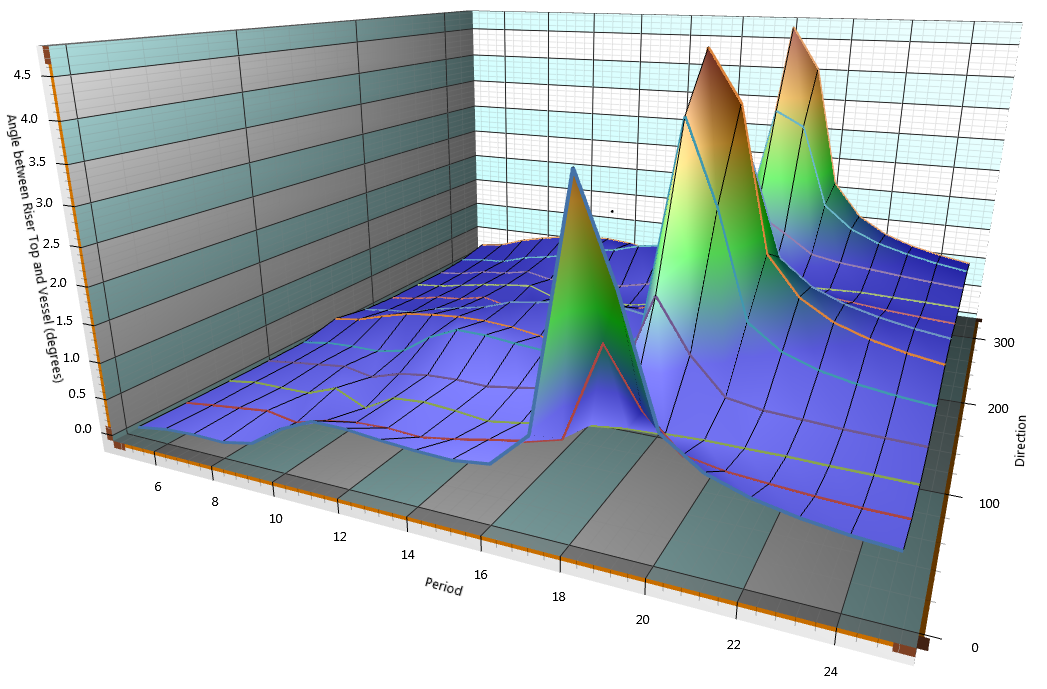
Maximum Hang-off Angle