Job Execution Service & Troubleshooting |
 
|
Job Execution Service & Troubleshooting |
|
There is a clear distinction between the graphical user interface and the finite element engine in Flexcom – these are, and always have been, separate programs in their own right. In all versions up to and including Flexcom 8.2, the user interface directly controlled the finite element engine. So for example, when you press the Run button to start an analysis, the user interface program invokes the finite element analysis program, providing the keyword data as input. During run-time, the interface and engine programs are in direct communication, so that the interface can display relevant progress information, and inform the user when the analysis is complete.
With the advent of Flexcom 8.3, there is an intermediary entity which manages the interaction between the interface and engine programs. When you initiate a run, the user interface now passes an execution command to an execution service, which in turn invokes the finite element engine. This approach has a number of important advantages. Firstly, the use of an intermediary service affords the user far greater control over the execution order of analyses, as noted above. Secondly, the analysis jobs may proceed as normal in the absence of the user interface. So you may close the user interface in order to free up resources, and restart it again later if desired. If your machine happens to shut down unexpectedly (e.g. via crash or manual reboot) while analysis jobs are in progress, the execution service re-launches itself upon restart and simply picks up where it left off.
In practice, the operation of the job execution service should be completely seamless, such that you need not even be aware of its existence. When the service is operating correctly, a green traffic light icon appears on the lower right hand corner of the user interface, as shown below. Strictly speaking, this feature is not contained within the Analysis Status view – it is actually part of the Status Bar to ensure it remains visible at all times – but as is inherently linked to the Analysis Status view, it is described here for completeness.
![]()
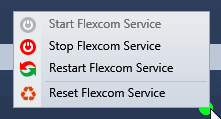
Occasionally the user interface may lose connectivity with the service and stop receiving analysis status updates. Should this happen, you can manually restart the execution service. To reboot the service, you can right click on the traffic light icon to invoke the context-sensitive menu, and select 'Restart Flexcom Services' from the list of options as shown. It may also be beneficial to 'Stop Flexcom Services', wait a few seconds, then 'Start Flexcom Services' again. If the 'Reset Flexcom Service' option is chosen from the context menu on the traffic light then the database will be reset (in addition to the services being restarted), removing everything from the Analysis Status View.
In rare circumstances, the services icon will appear green but it is not possible to run any Flexcom simulations. This problem typically manifests itself by the job status appearing to be permanently stalled (i.e. the cursor continually displays the rotating circle icon in the analysis status view). Should this happen, restarting the job execution service as suggested above may not fix the problem. Sometimes Flexcom does not have sufficient permissions to stop and start services even if it is running it administrator mode, and in this case you should try using the Windows Services app directly.
If you find yourself in this predicament, try the following steps...
1.Pause the job, and wait for the software to confirm it is paused.
2.Stop the job, again wait until you receive a stop confirmation.
3.Stop Flexcom services by right clicking on the traffic light icon. Wait a few seconds.
4.Start Flexcom services.
5.Now try running the job again. If it runs fine, disregard the remaining points. If not, proceed to step 6.
6.Follow steps 1-2 again.
7.Type ‘services’ into the Windows start menu search bar, and when you see ‘Services’, right click on it and select ‘Run as Administrator’.
8.Examine the list of services and look for the ‘Flexcom Execution Engine’ service which corresponds to the version you are running. Once you find it, right click and select 'Stop Service'.
9.If you are running and older version of Flexcom (e.g. 8.6.4 or earlier), look for ‘Flexcom Watcher Service’ for that version, and stop the service also.
10.Now try running job again. If it still fails to run, please contact us. We will be able to deploy debugging tools to get Flexcom up and running again for you.
If the Windows Services app does not allow you to stop the service, you could try using the Windows Task Manager.
1.Type ‘task manager’ into the Windows start menu search bar, and when you see ‘Services’, right click on it and select ‘Run as Administrator’.
2.In Task Manager, select the Services tab, and find the relevant Flexcom Execution Engine service (you may have several versions running).
3.Right-click on the service and select "Go to details", this will take you directly to the process of the service in the Details tab.
4.Right click on the process it and select "End process tree".
In order to improve performance, it may also be worth deleting the execution engine database file. This file contains a list of the status of previously run analyses, and this can be very useful when checking completion status for large analysis jobs run overnight. But apart from that initial inspection, it generally contains lots of historical information which is not required. You can open C:\ProgramData\Wood\Flexcom\Version 2026.1.1 in Windows Explorer and delete ExecutionEngineData.db3. Note that the execution services must be stopped before you delete the database file. Don't forget to restart the services from Flexcom or the Windows Services app afterwards.
If you are persistently experiencing communication problems between the user interface and the execution service, it is likely that communication is being blocked by a local firewall. Users in this predicament will either see a red traffic light icon at all times (even after following the restart procedure discussed above), or analysis jobs will appear to hang indefinitely (denoted by a rotating circle icon), or perhaps analysis runs will remain in the unknown state (denoted by a blue question mark icon). You should contact your local IT department and ask them to check if firewall settings are blocking Flexcom communications. Typically this may be caused by anti-virus software or organisational security policies but the good news is that the problem may be readily overcome by adding some exceptions to these generic rules.
Flexcom's installer pack adds all the required rules and exceptions to Windows Firewall during the software installation process. However if a third party firewall is installed, then a local IT person will have to make some configuration changes themselves. For example, McAfee firewall is known to cause such issues, and Flexcom users have successfully added exceptions to the McAfee settings to prevent it from interfering with the software. The following network communication capabilities are required for Flexcom to work.
For the following processes...
•MCS.Flexcom.exe
•MCS.Flexcom.Wind.exe
•MCS.Flexcom.Wave.exe
•AnalysisExecutionEngine.exe
•MCS.Flexcom.AnalysisLauncher.exe
•client.exe
•fl3.exe
...the following networking access is required:
•In/Out UDP communications to/from localhost, port 3702
•In UDP communications to 239.255.255.250 from localhost, port 3702
•In/Out TCP communications to/from localhost, port 8000 (note that if this port number is used by another application, it is possible to configure Flexcom to use different port number via the Flexcom Settings dialog)
Several different versions of Flexcom may exist side-by-side on a single machine (users often wish to revert to an earlier version if some re-work is required to an old engineering project after its completion). In order to facilitate this, Flexcom's installer pack includes the version number in the default installation path. In the following examples, X.X.X is the version number being installed.
Recent versions of Flexcom are installed to:
•C:\Program Files\Wood\Flexcom\Version X.X.X\Bin (e.g. C:\Program Files\Wood\Flexcom\Version 8.10.4)
Versions of Flexcom prior to 8.9 were installed to:
•C:\Program Files\Wood Group\Flexcom\Version X.X.X\Bin (e.g. C:\Program Files\Wood Group\Flexcom\Version 8.6.4)
Versions of Flexcom prior to 8.6 were installed to:
•C:\Program Files\MCS Kenny\Flexcom\Version X.X.X\Bin (e.g. C:\Program Files\MCS Kenny\Flexcom\Version 8.4.1)
Your local IT personnel should ensure to use wildcards where applicable to account for variations described above.
Occasionally we have received reports from users that Flexcom fails to run any simulation. The analysis control module (the pre- and post-processing part of the finite element program) issues an error message similar to the following:
•The application was unable to start correctly (0xc000007b). Click OK to close the application.
•ACM stopped working. Error code '0xC0000138'.
Although unrelated to the job execution service, the issue is covered here as this page is designed to help users to overcome any issues with simulation execution. This problem actually relates to redistributables - these are libraries of software components which Flexcom relies on to operate correctly. The redistributables are either not installed correctly or have somehow become corrupted after a successful installation. Should you encounter this problem, follow these steps to rectify this issue.
1.This process requires administrator privileges. If you do not have local admin rights on your machine, contact your IT department for assistance.
2.Close any Flexcom applications which you have running.
3.Check if your machine is 64-bit or 32-bit.
4.Open the Windows Control Panel and look for an option to uninstall programs, typically found under 'Programs and Features'. The layout of options will depend on which version of Windows you have. Open the list of programs which are installed on your machine.
5.Using the search bar in the top right hand corner of your screen, search for “Visual Fortran” in the list of installed programs.
6.Remove/uninstall any programs called "Intel(R) Visual Fortran Redistributables on Intel(R)64" or similar. Remove all versions, both 32 and 64-bit.
7.Download the Flexcom installer pack. Please ensure to download the full offline version of the installer, as shown below.

8.Unzip the installer pack to some location on your local hard drive.
9.Using Windows Explorer, open the "Prerequisites" sub-folder of the pack, then the "IVFRedist" sub-folder.
10.Install the Intel(R) Visual Fortran Redistributables, by clicking on the relevant MSI file, depending on whether your machine is 64-bit or 32-bit.
Occasionally the job execution service can report simulations as Terminated (![]() ) even though they have completed successfully. These are known as 'false failures' by Flexcom power users. This is caused by a delay in the communication between the user interface and the finite element engine. The problem only occurs sporadically, but seems to be most prevalent in large batch runs, when the machine is fully loaded and all CPUs are busy. It can be a source of inconvenience as a large analysis job can stall halfway through, as it can prevent files in a restart chain from starting if earlier ones are deemed to have failed. Most users will never experience this issue, but if you are experiencing problems, some helpful advice is given here.
) even though they have completed successfully. These are known as 'false failures' by Flexcom power users. This is caused by a delay in the communication between the user interface and the finite element engine. The problem only occurs sporadically, but seems to be most prevalent in large batch runs, when the machine is fully loaded and all CPUs are busy. It can be a source of inconvenience as a large analysis job can stall halfway through, as it can prevent files in a restart chain from starting if earlier ones are deemed to have failed. Most users will never experience this issue, but if you are experiencing problems, some helpful advice is given here.

False Failures
The Execution Engine is designed to detect situations where an analysis process has stopped unexpectedly, or was terminated deliberately, and in such cases the analysis is marked as Terminated (![]() ). In some cases this detection may be false and occur a result of a major slowdown in communication between an analysis process and the Execution Engine. This may happen when an analysis job with thousands of analyses is running and the CPU utilisation on the machine is 100% or close to it. In such cases, even though the analysis is marked as Terminated, the related .OUT file for the analysis is present and contains "Successful Flexcom Analysis" message at the end of it.
). In some cases this detection may be false and occur a result of a major slowdown in communication between an analysis process and the Execution Engine. This may happen when an analysis job with thousands of analyses is running and the CPU utilisation on the machine is 100% or close to it. In such cases, even though the analysis is marked as Terminated, the related .OUT file for the analysis is present and contains "Successful Flexcom Analysis" message at the end of it.
The best way to reduce the likelihood of the problem occurring is to reserve a CPU core or "logical processor" for the user interface and its associated tasks. This helps to alleviate congestion in the communication channels and rectifies the issue in the vast majority of cases where it occurs.
1.If you are running Flexcom 8.13.3 or earlier, then you can achieve this by doing either of the following:
a.Keep the Flexcom user interface open (especially during batch runs) - Flexcom automatically reserves one logical processor for the user interface while it remains open.
b.Use Flexcom Settings to limit the number of analysis processes that can be started simultaneously to at least one less than the number of logical processors available on the machine. This setting will remain in effect even if you close Flexcom user interface. You can find the number of available cores in Windows Task Manager (see notes).
2.If you are running a later version, then you don't have to worry, Flexcom is already configured to keep one logical processor for handling user interface and communications. It is possible to override this setting via the Flexcom Configuration File if you wish, but it is not recommended if you're running large batches of analyses.
If you are running Flexcom on a powerful machine with a high number of CPUs, and the machine is heavily loaded with Flexcom simulations, congestion can sometimes occur in the communication channels. One way to alleviate information communication gridlock is to limit the number of CPUs which Flexcom may access. On the Flexcom Settings window, you can set a limit on the number of simulations which Flexcom can perform simultaneously, as shown below.

Note that reducing the number of active CPUs does not necessarily mean reducing the overall throughput of Flexcom simulations. On a powerful machine with a high number of CPUs and a large amount of RAM, access to the hard disk often becomes a bottleneck which limits overall performance. While you can use *DATABASE CONTENT to reduce database sizes, placing a reasonable limit on the number of active CPUs can sometimes be beneficial in terms of overall performance. The balance is machine specific, and you can easily perform some test cases to determine the optimum settings for a particular server machine.
Advanced users may wish to change communication timings via the Flexcom Configuration File. You should first try to reduce the analysis update time setting PreKeyUpdateInterval to reduce the frequency of communications between analysis processes and the Execution Engine. If that does not help you can increase the analysis disconnect time-out setting PreKeyClientDisconnectWaitTimeout to make sure that an analysis process waits long enough for the Execution Engine to receive and process the communication messages.
Sample suggestions might be as follows:
•The default analysis update time (PreKeyUpdateInterval variable) is 3000 milliseconds (3 seconds). This value could be increased to 60000ms (1 minute). This means that analysis progress information (e.g. current simulation time shown in the Analysis Status View) will only update once every minute for any given simulation. This is not necessarily a problem if you are running lengthy dynamic simulations and will greatly reduce the communication load.
•The default analysis disconnect time-out (PreKeyClientDisconnectWaitTimeout variable) is 300000 milliseconds (5 minutes). This should be adequate in the vast majority of cases but it could be increased to 1800000ms (30 minutes).
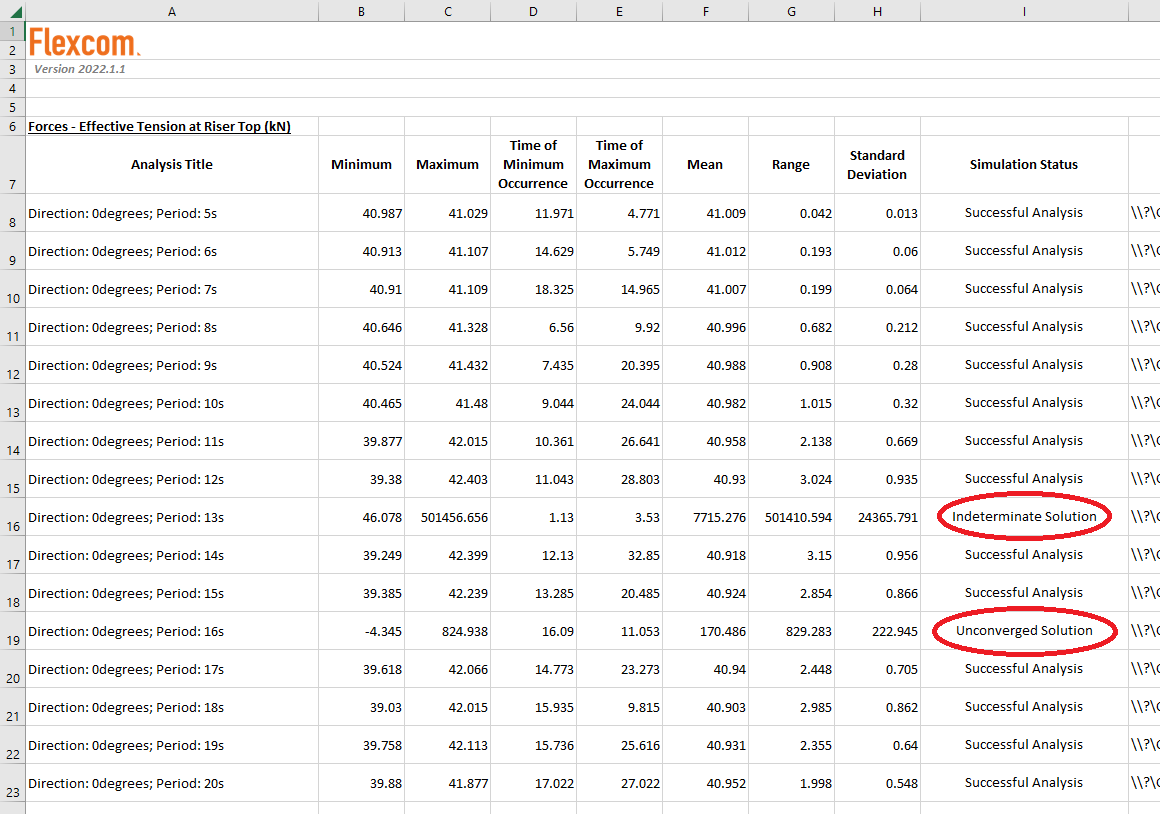
If the suggestions above do not fully resolve the problem of false failures, you will need to check the status of each simulation. The major implication of false failures is that you do not know how many (if any) of your simulations have actually failed. For a large load case matrix, it can be difficult and time consuming to examine all the OUT files. In theory you could write a script to automatically interrogate the OUT files, but a more straightforward way is to use summary postprocessing and collation. During summary collation, Flexcom checks and reports the status of each simulation, and any failed simulations will be obvious from the collation spreadsheet, as shown in the sample below. Because the simulation status check is handled by the analysis control module (the pre- and post-processing part of the finite element program), it is not affected by any communication issues which may have arisen in the job execution service.
Notes
•A CPU (sometimes referred to as a socket) is a physical processor unit inside a computer, there can be one or more CPUs installed in a computer.
•A Core is a part of the CPU that is responsible for running a process (e.g. Flexcom Analysis), a CPU typically has multiple Cores to facilitate multiple processes in parallel.
•A Logical Processor is an ability of a Core to run more than one process at a time (typically two processes per Core) and is a feature present in most of the more powerful CPUs.
•When you open the Performance tab in Windows Task Manager you can see the configuration of your machine and how many CPUs, Cores, and Logical Processors are present.