Extrapolation Technique |
 
|
Extrapolation Technique |
|
Following successful completion of the time domain simulations for the reference seastates, you are required to create time history plots of variables of interest via database postprocessing.
•Flexcom users may request these plots via the *TIMETRACE keyword, which leads to the creation of 2D Plots with an MPLT file extension.
•Users of Flexcom Wave need not worry about this preliminary step as all tasks are handled automatically by the software for user convenience.
As discussed previously, you will already have grouped similar seastates in the wave scatter diagram into blocks, and nominated a reference seastate to represent each block. For a given block, the Summary Wave Scatter feature estimates a time history of each variable of interest for the remaining cells within the block, VARCell(t), using the following relationship:
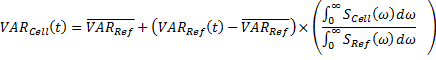 (1)
(1)
where VARRef(t) is the time history of the variable of interest for the reference seastate,![]() is the mean value of the reference time history, SCell is the wave elevation spectrum for the non-reference cell, and SRref is the wave elevation spectrum for the reference seastate.
is the mean value of the reference time history, SCell is the wave elevation spectrum for the non-reference cell, and SRref is the wave elevation spectrum for the reference seastate.
Note that the time histories of resultants/magnitudes are always positive by definition, so the mean value may be meaningless. The following types of variables represent resultants/magnitudes:
•TYPE=KINEMATIC - DOF 7 (Magnitude of Rotation) and DOF 8 (Magnitude of Translation)
•TYPE=REACTION - DOF 7 (Magnitude of Rotation) and DOF 8 (Magnitude of Translation)
•TYPE=FORCE - Force variables 8 (Resultant Bending Moment), 9 (Resultant Curvature), 10 (Resultant Shear), 13 (von Mises Stress) and 18 (von Mises Stress (API-2RD))
Note also that for the special case of Damper Power (force variable 23) the mean value is set to zero.
Flexcom subsequently computes maximum, minimum, range and standard deviation values from the estimated time history in the standard fashion. This information is then used to generate a Summary Database File for each non-reference seastate in the block.