OC4 P2 LC3.3 Stochastic, above rated |
 
|
OC4 P2 LC3.3 Stochastic, above rated |
|
This load case is very similar to OC4 P2 LC3.2, but the mean wind speed is higher in this case (Vhub=18.0m/s rather than 11.4m/s). Although this load case is not discussed by Robertson et al. (2014), comparisons are presented here in a similar manner to the preceding load case. Specifically, the mean and variance of platform surge, platform pitch, bending moment at the base of the tower, and generator power are considered. Generally speaking, Flexcom shows good agreement with the other software tools. Note that results from Bladed (GH) were not found in the IEA Wind Task 30 results library, so we have used results from Bladed Advanced Hydro Beta (GH) instead in this comparison.
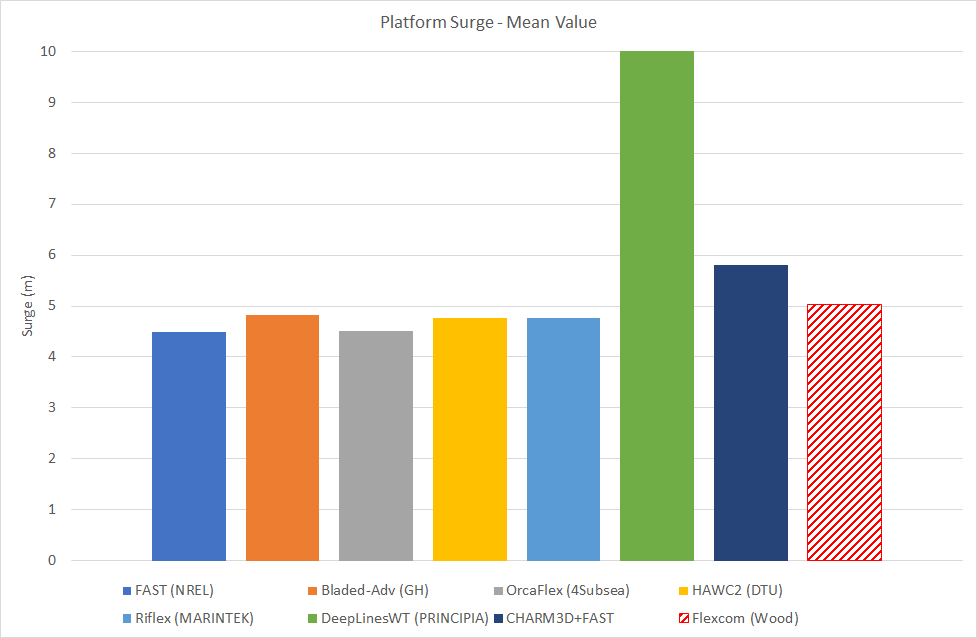
The mean surge shows reasonable agreement across the different software products, with the exception of DeepLinesWT (Principia) which appears to be inconsistent with the others. Although the full extent is not shown below, this is about 5 times the average of the others. Without comment from Robertson et al. (2014), the reasons for this are not clear, but it could be something as simple as a mistake in the presentation of results. Regardless, some variation is expected depending on how drift forces are being modelled (refer to OC4 P2 LC2.1 for further information). The inclusion of wind tends to improve the correlation in surge results, because the wind thrust force is much larger than the hydrodynamic drift force, and hence the mean surge offset is significantly greater when wind is included.
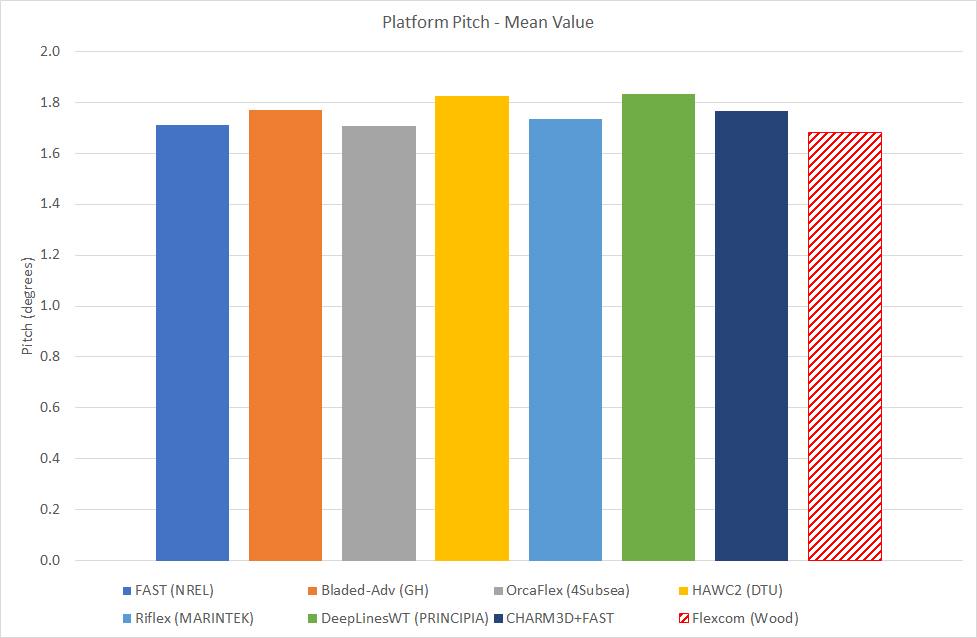
Close agreement is shown between all software tools, including Flexcom, for the mean pitch response. The inclusion of wind tends to improve the correlation in pitch results, because the wind thrust force is much larger than the hydrodynamic drift force, and hence the mean pitch offset is significantly greater when wind is included.
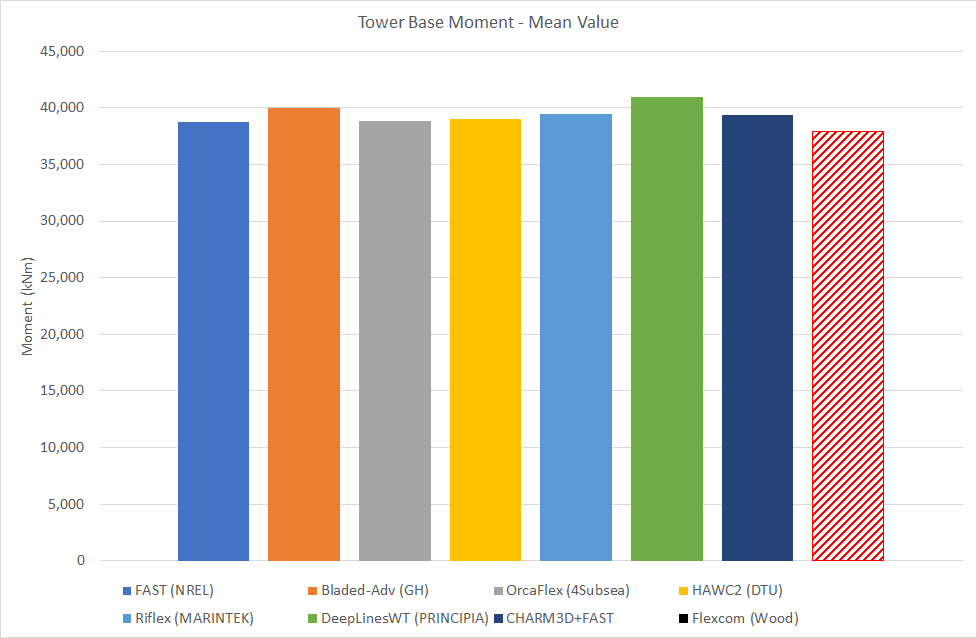
Close agreement is shown between all software tools, including Flexcom, for the mean tower base moment.
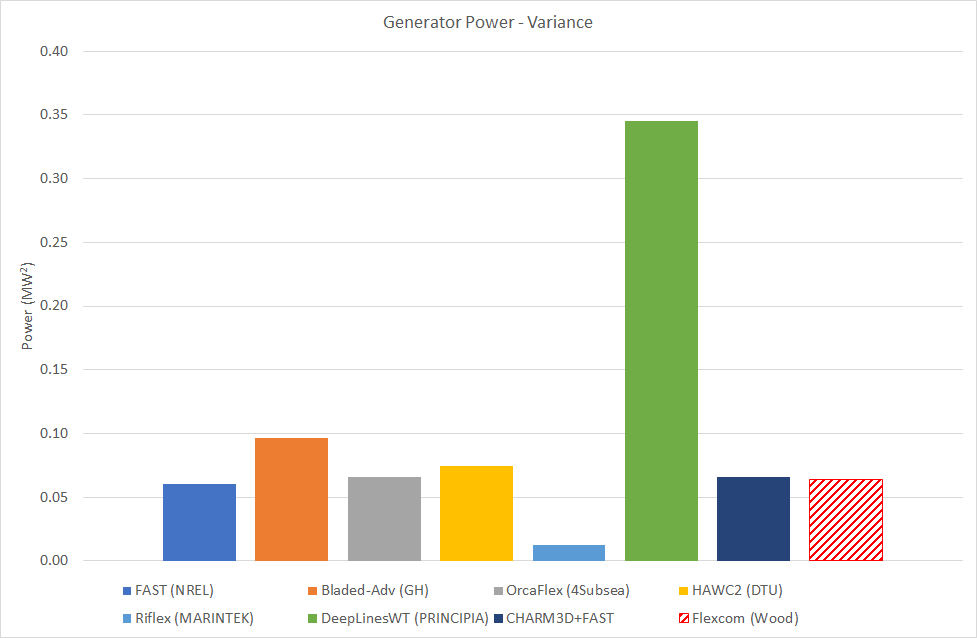
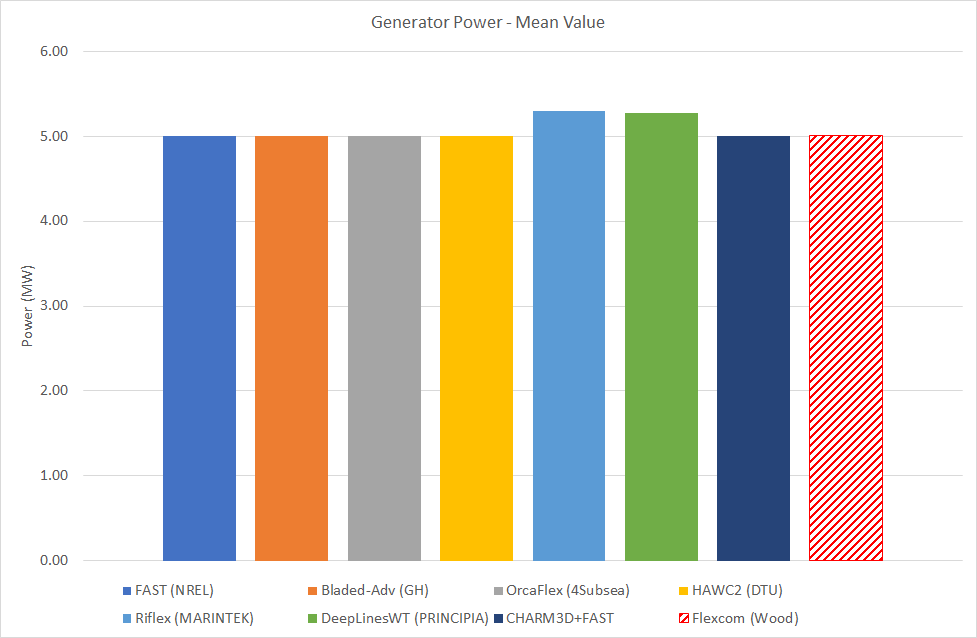
Very close agreement is shown between all software tools for the mean generator power. Unlike OC4 P2 LC3.2, where the mean wind speed is lower (Vhub=18.0m/s rather than 11.4m/s), the wind speed is this case is sufficiently high to keep the turbine operating at its rated power. Hence many of the software tools, including Flexcom, predict exactly 5MW.
Variance of Response
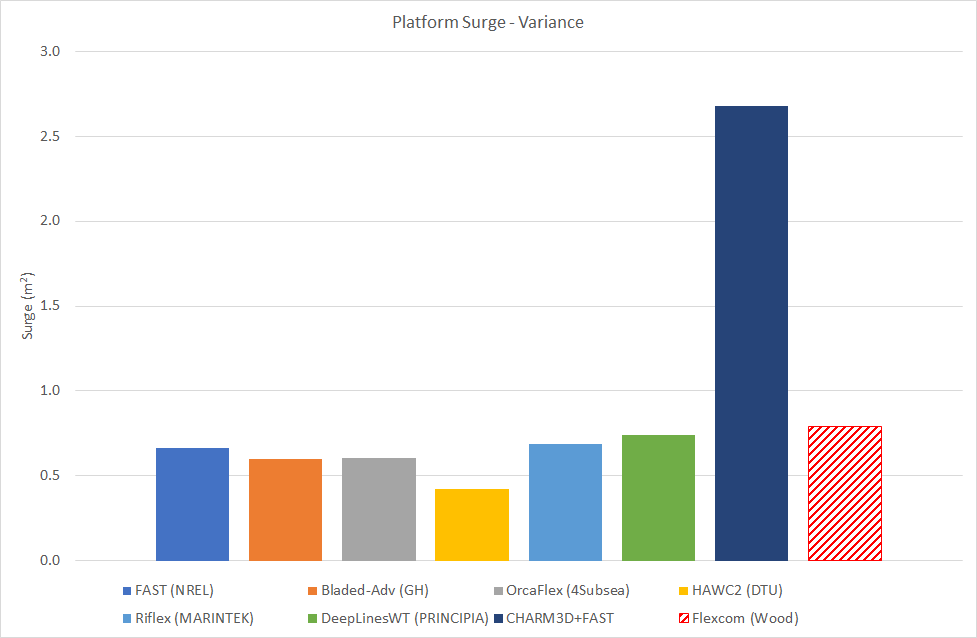
The variance in surge shows some variation across the different software products, again possibly caused by different approaches to modelling drift forces. Results from Charm3D+FAST (ABS) show a surge variance which is larger than the other software tools.
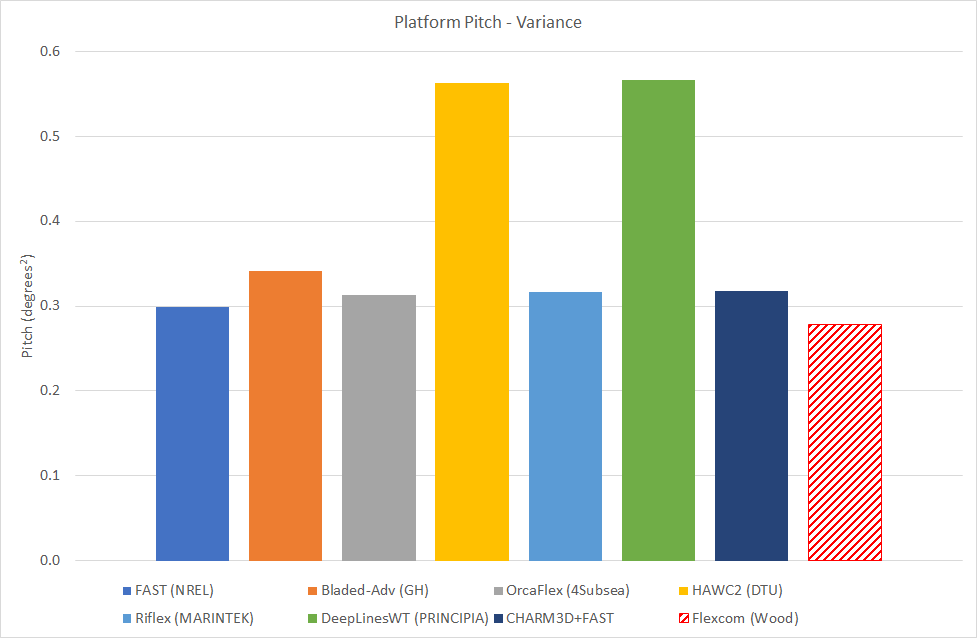
The variance in pitch shows some variation across the different software products. However the response predicted by Flexcom shows good general agreement with the average value.
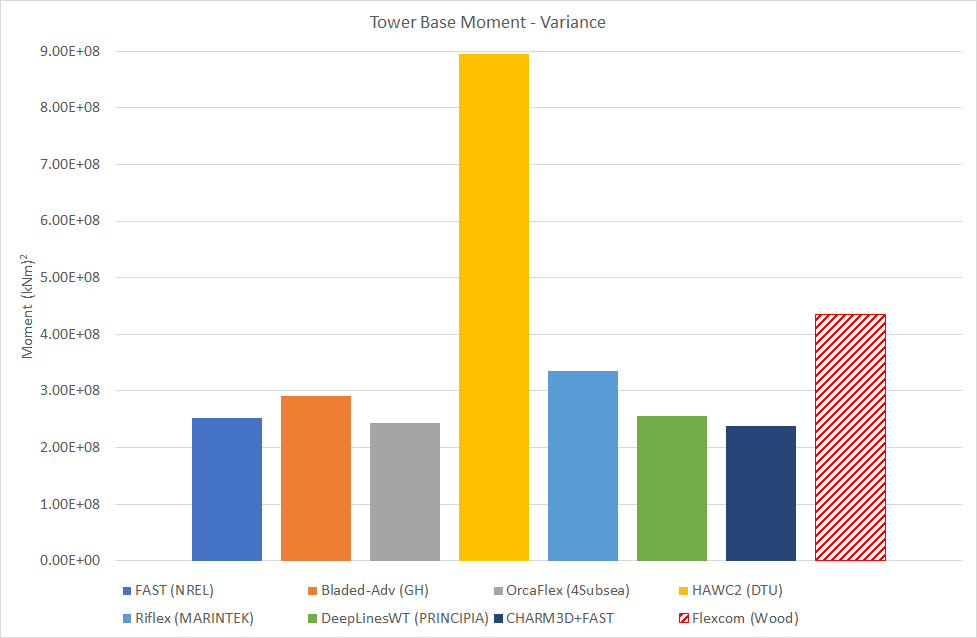
The variance in tower base moment shows reasonable agreement across the different software products, with the exception of HAWC2 (DTU) which appears to be inconsistent with the others. Based on OC4 P2 LC3.2, it seems likely that the discrepancy probably results from an incorrectly prescribed axis definition for the output.
The variance in generator power is extremely small. Unlike OC4 P2 LC3.2, where the mean wind speed is lower (Vhub=18.0m/s rather than 11.4m/s), the wind speed is this case is sufficiently high to keep the turbine operating at its rated power. The average variance in generator power here is about 5 times lower than the corresponding value for OC4 P2 LC3.2.