OC4 P1 LC5.6 Steady Wind Deans Wave |
 
|
OC4 P1 LC5.6 Steady Wind Deans Wave |
|
This load case combines elements from OC4 P1 LC2.2 (which considers a rigid offshore wind turbine subjected to steady wind loading) and OC4 P1 LC4.3b (which considers a flexible offshore structure subjected to Dean's stream wave loading). Results are naturally very similar to those presented for these simpler load cases. Although this load case is not discussed by Popko et al. (2012), a broad comparison is presented here, building on the results presented for the earlier load cases.
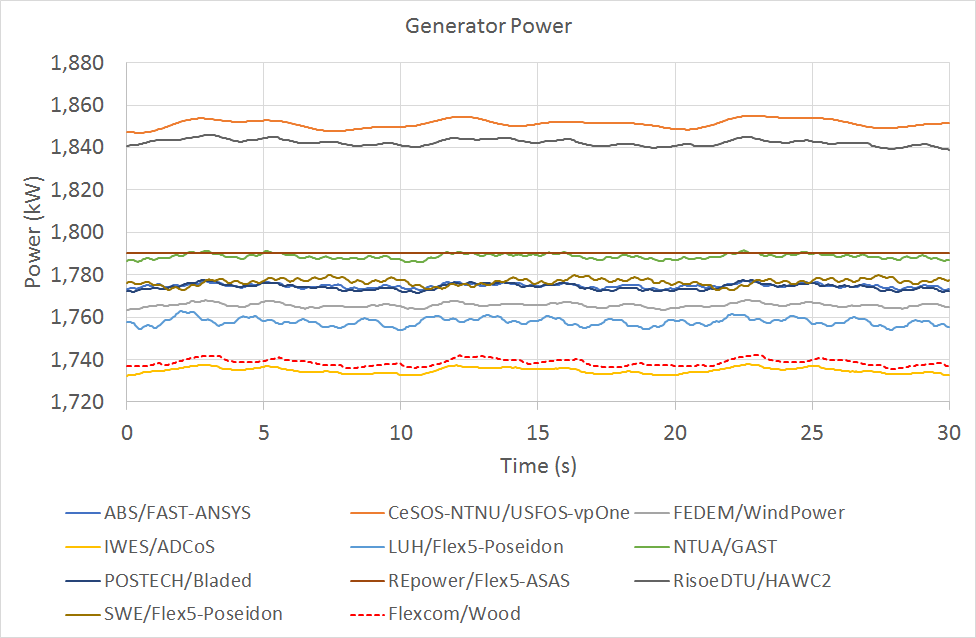
Good agreement is shown between all software tools for the mean generator power. The generator power predicted by Flexcom is slightly lower than most of the other software tools (apart from ADCoS which had an acknowledged miscalculation of the flow stagnation effect in front of the tower during OC4). Flexcom's mean power is 1738.6 kW, just 2.6% below the average (1785.6 kW). It is worth noting that there is a 6.5% variation across the other software tools also.
It is worth noting that the Flexcom results were produced using Flexcom 8.12.1 which is coupled with AeroDyn V15.02.04 (14-Apr-2016). The OC4 Phase I results were published in 2012 at which point the latest version of AeroDyn was Version 14. Improvements to the aerodynamic modelling software primarily account for the differences in generator power predicted by Flexcom and ABS/FAST-ANSYS. Variations in the aerodynamic theories underpinning each software product may also be a contributing factor for differences in generator power. Similar trends were observed for the OC4 semi-submersible and you are referred to OC4 P2 LC3.1 if you are interested in a more detailed discussion.
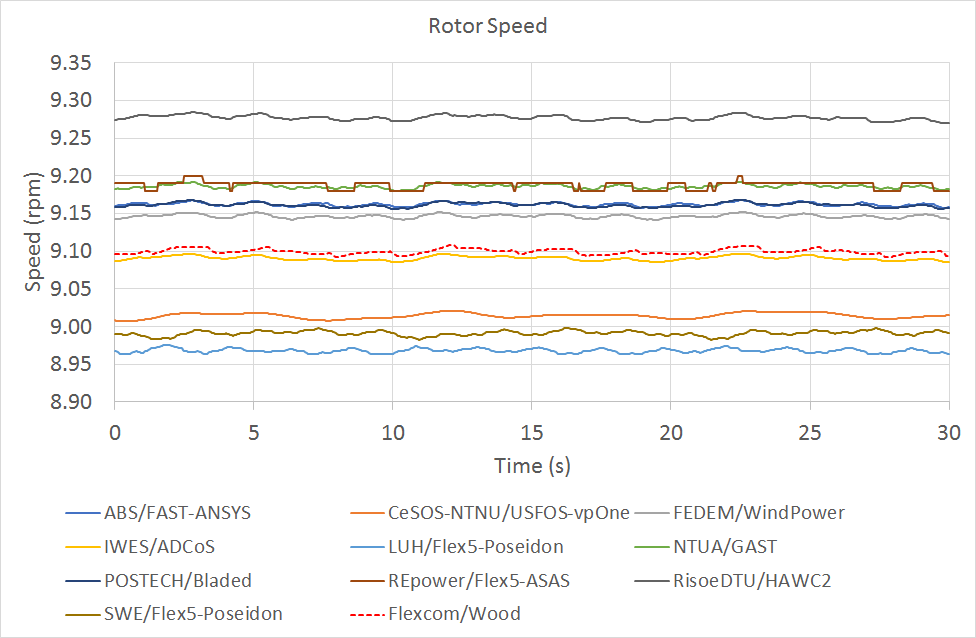
Close agreement is shown between all software tools for the rotor speed. Difference in mean rotor speed is less than 3.4%. Flexcom's results are very close to the median of OC4 data.
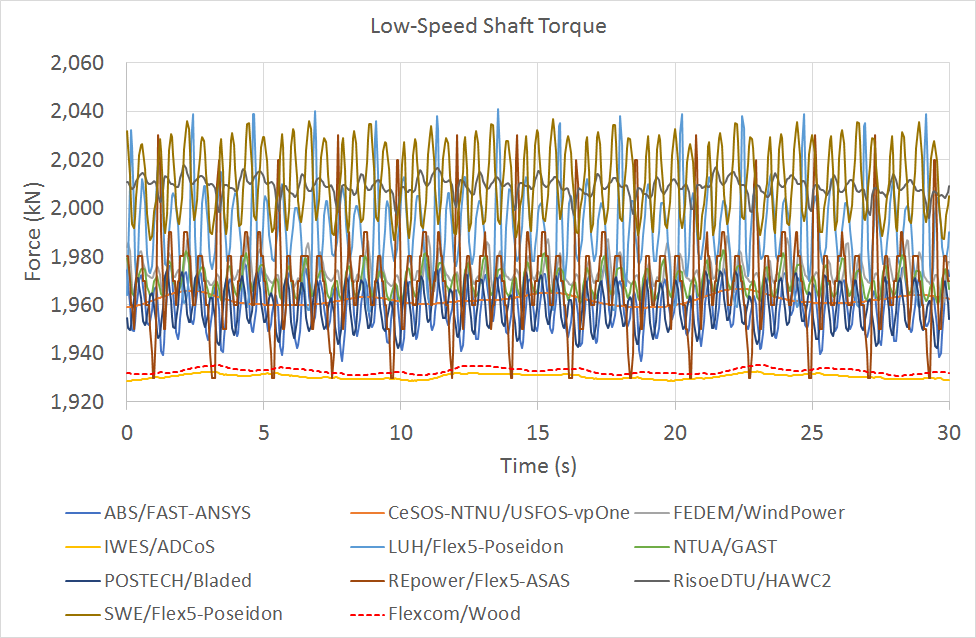
The low speed shaft torque shows good agreement between many of the software tools, with most codes showing peaks corresponding the blade passing (3P) frequency. These are not demonstrated by the Flexcom signal, given that a simplified RNA model is used in Flexcom 8.12.1. Instead the low-speed shaft torque is derived from the generator torque and the gearbox ratio, which leads to a smoother signal than most of the other software tools (note that the low-speed shaft torque is also calculated indirectly for the IWES/ADCoS results, which show close agreement with Flexcom).
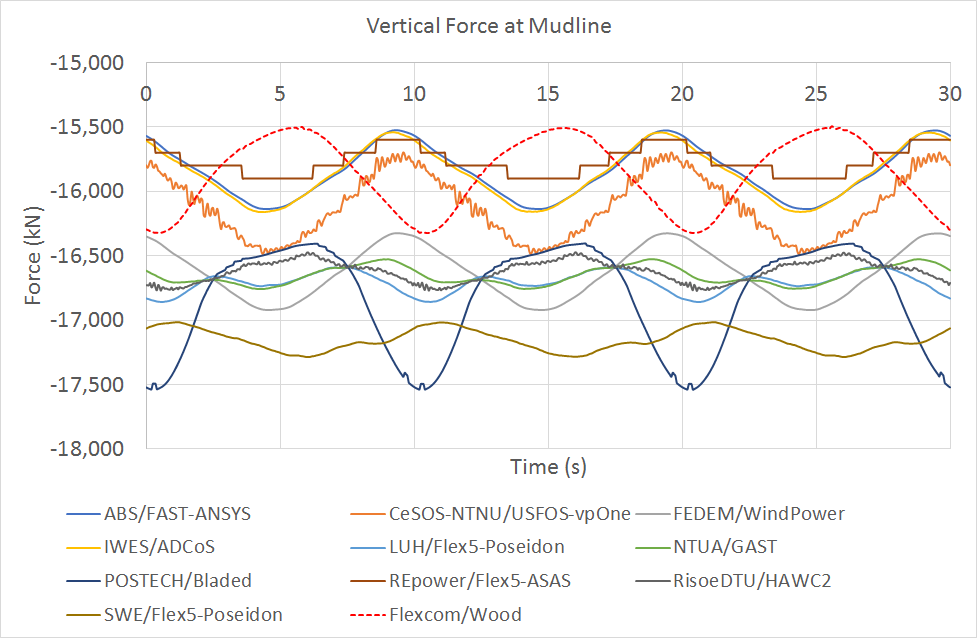
The vertical force at the mudline predicted by Flexcom shows good agreement with the other software tools. As outlined in OC4 P1 LC2.1, the project participants which omitted the buoyancy force at the mudline predict a mean vertical force at about -16600 kN, while others (including Flexcom) which included this term predict a mean vertical force of about -15800 kN. Differences in peak-to-peak amplitude of vertical force are mainly due to the buoyancy calculation method, whether displaced volume or pressure integration. Additionally, different masses for the jacket substructure and marine growth contributed to discrepancies.
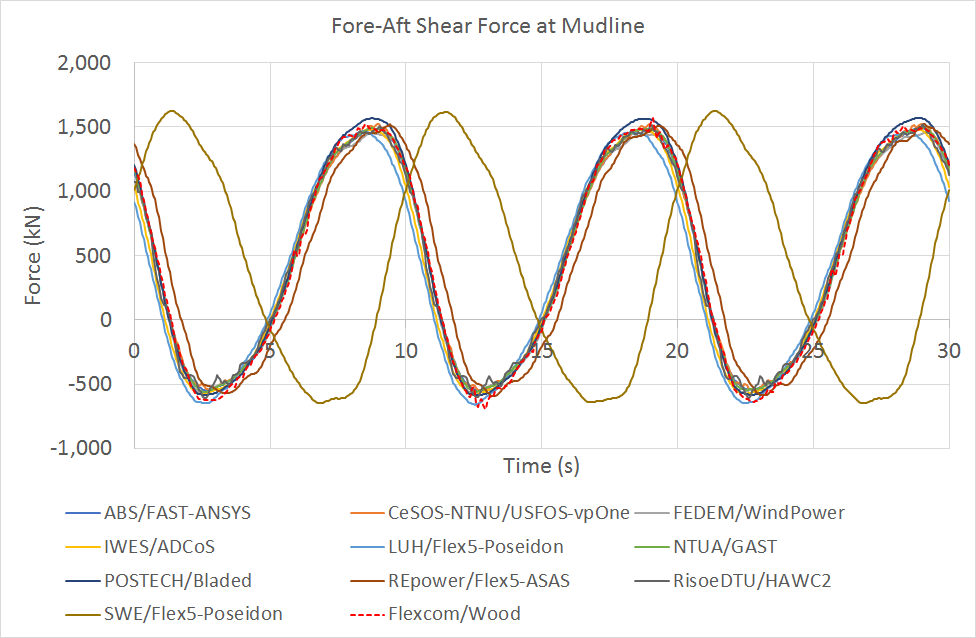
Very close agreement is shown between all software tools for the fore-aft shear force at the base of the jacket. Minor discrepancies in peak-to-peak amplitude may be caused by dissimilarities in implementations of wave kinematics, or slight differences originating in the modelling of the support structure. Results from SWE/Flex5-Poseidon appear out of phase with the other tools - a minor fault in the software at that time caused an unexpected phase shift in the output.
The fore-aft shear force at the top of the tower shows some variation across the different software products, but broadly speaking, good general agreement is observed. Tower shear is heavily influenced by wind rather than wave loading, so this plot shows similarities with the corresponding result from OC4 P1 LC2.2. It is interesting to note that the inclusion of wave loading, and the introduction of flexibility into the support structure, has negated the downward peaks at the blade passing (3P) frequency which were so clearly evident in OC4 P1 LC2.2. The Flexcom model displays some high frequency response at regular intervals corresponding to the 3P frequency. Further work is required to ascertain the precise source of this response; however it is believed to be related to the rigid blade assumption inherent in the RNA model in Flexcom 8.12.1. It is intended to verify this using the more advanced RNA model presently under development. Notwithstanding this, the Flexcom model matches the other tools for all of the key response parameters.

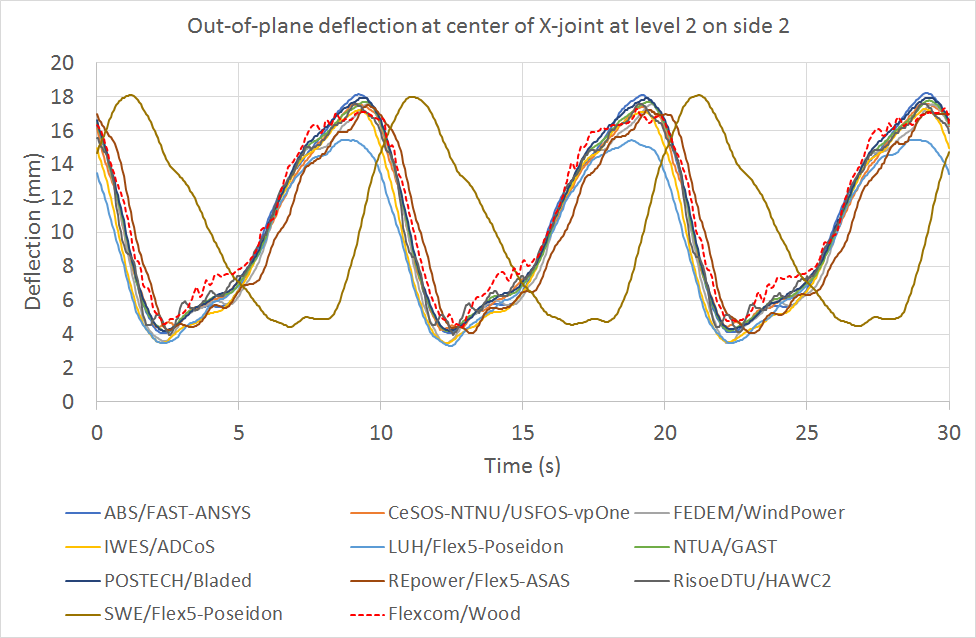
The out-of-plane displacement in the fore-aft direction, of the central joint of the cross-brace at level 2 on side 2 (see OC4 Jacket schematic for further details), shows a remarkably good agreement across the different software products, including Flexcom. Results from SWE/Flex5-Poseidon appear out of phase with the other tools - a minor fault in the software at that time caused an unexpected phase shift in the output.
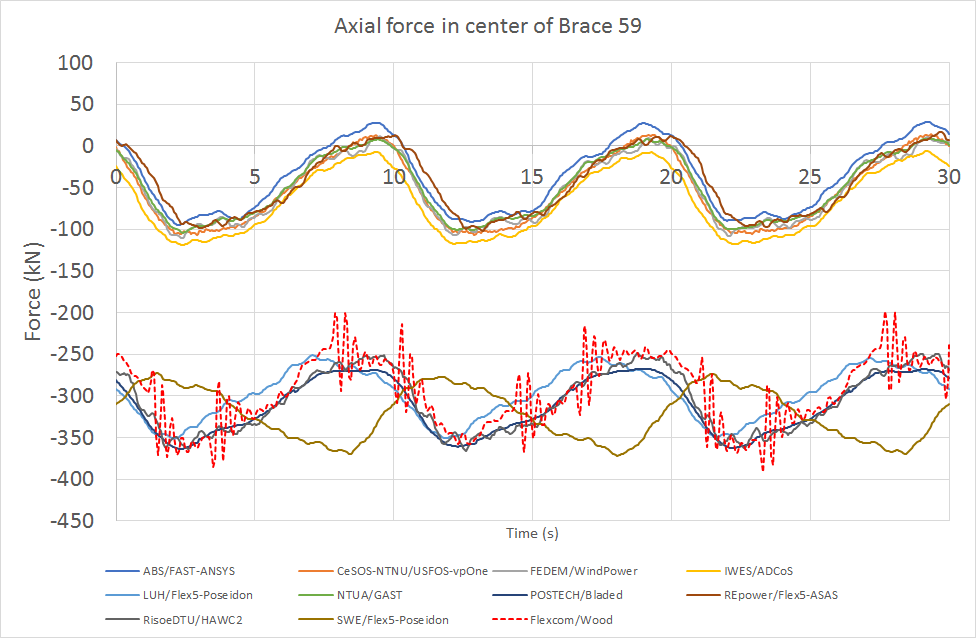
The axial force in brace B59 at the lowest X-brace (see OC4 Jacket schematic for further details) shows some variation across the software products in terms of its mean value. However, variations about the mean show good agreement between the tools, including Flexcom. Differences in mean values may be largely attributed to differences in buoyancy modelling and discretisation of the brace (leading to a different measurement location). Like the tower-top shear force, Flexcom shows some higher frequency noise in the brace axial force also, so these issues are inter-related.