Timetraces and Model View Animation |
 
|
Timetraces and Model View Animation |
|
If you are viewing a Model View animation and have a timetrace plot from the same analysis concurrently open or on display in the user interface, then a moving line on the plot will automatically show you the value of the variable plotted at each Model View time. This screen grab illustrates the operation:
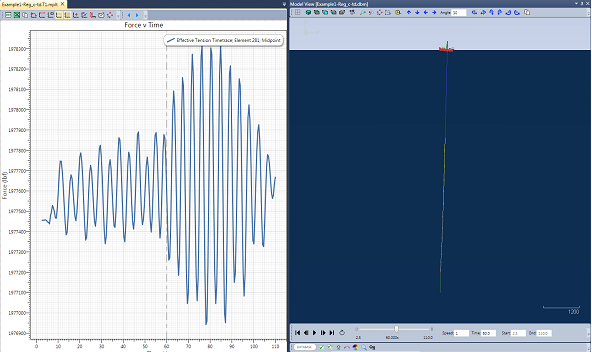
The Model View is currently displaying the solution at 108.81s; the vertical line on the timetrace picks out the value of the effective tension at the midpoint of Element 281 at that time. You even have the option to ‘move’ the animation and the line on the plot to a specific time, using the following sequence of steps:
•Pause the animation
•On the plot, move the cursor to the time that you want to select
•Simultaneously press Alt and the mouse left button; the line will move to the time you selected and the structure configuration at that time will be displayed in the Model View
This feature can be very useful for example if you are trying to understand what is actually happening in a structure (or part thereof) when a key parameter is taking on a particular value. You can move the animation to the time of that value, and then use the Model View to examine the structure response at that time in detail.