Initial Static Analysis |
 
|
Initial Static Analysis |
|
The restart facility allows you to specify that a particular analysis is to be restarted from a previous run, to build up to the full dynamic solution in stages. In a restart, the structure configuration at the end of the preceding analysis becomes the starting configuration for the restart. Refer to Restart Analyses for further information on this feature.
Naturally, all time domain analyses require the specification of time variables. Since a static analysis is one which considers time invariant loading and structure response, time variables are effectively meaningless in this context. However you are also required to specify time variables for a static analysis in Flexcom. This is purely a consequence of the historical evolution of the software. Refer to Time Variables in Static Analysis for further information on this feature.
An initial static analysis is typically run from t=0 to t=1 second using a single fixed time step, and this standard approach is adopted for this example, as shown in the figure below. Note also that the maximum number of iterations is increased to 50 to aid convergence in the initial static analysis.
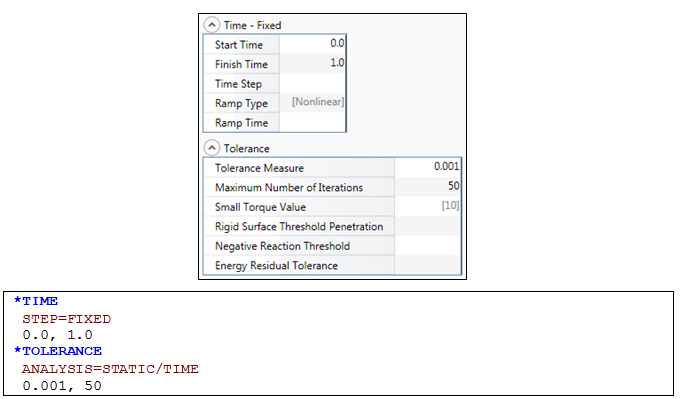
Initial Static Analysis Time Variables
Refer to the *TIME keyword for further information on these data inputs.
The type of the analysis to be performed must be specified in each $LOAD CASE section. In this case, a static analysis is required, as shown in the figure below.
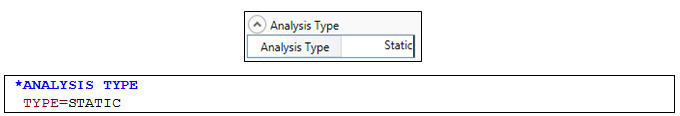
Refer to the *ANALYSIS TYPE keyword for further information on these data inputs.
Database Postprocessing is the most powerful and widely used postprocessing facility in Flexcom. The database files provide a very detailed picture of the structure response. For large models, or long simulations with a large number of database outputs, the database files can become quite large. However, this is not a concern for static analyses, or indeed the dynamic analysis studied in this example. Refer to Database Postprocessing for further information on this feature.
In this example, the postprocessing requests are specified before the analysis begins, via the standard output option. This option allows you to quickly request a summary of pertinent information, without the inconvenience of explicitly requesting specific outputs. For every element set referenced, Flexcom produces outputs of effective tension, resultant bending moment and von Mises stress for that set.
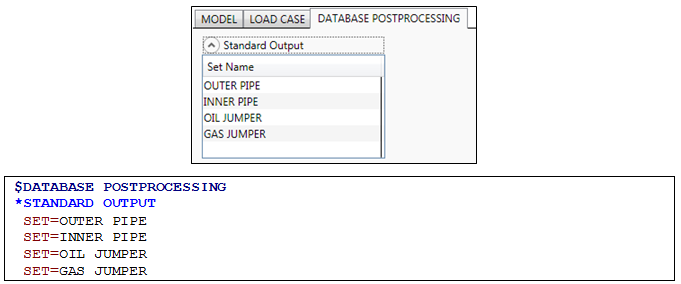
Database Postprocessing Requests
Refer to the *STANDARD OUTPUT keyword for further information on these data inputs.
Specification of the model geometry, structural and hydrodynamic properties, environment and loading data, vessel and RAO data, boundary conditions and solution parameters is now complete, so you should save the keyword file and run the analysis.
When a run is in progress, you can monitor its status via the Analysis Status View. The progress bar is naturally most beneficial for longer dynamic analyses (e.g. where it provides an approximate estimate of remaining CPU time), and sample progress information is shown in the figure below.
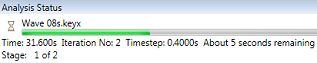
Analysis Progress Indicator
Another useful feature in the File View is that the program provides an indication of the status of the analysis. When the run has finished, the icon associated with the keyword file changes to ![]() , indicating that the analysis has completed successfully. You may have noticed the icon next to the keyword file name was previously
, indicating that the analysis has completed successfully. You may have noticed the icon next to the keyword file name was previously ![]() , indicating the analysis had not yet been run. As the computation time for the static analysis is relatively short, you probably won’t have noticed that the icon briefly changed to
, indicating the analysis had not yet been run. As the computation time for the static analysis is relatively short, you probably won’t have noticed that the icon briefly changed to ![]() , indicating that the analysis was currently in progress.
, indicating that the analysis was currently in progress.
You can view the analysis results using the Plotting facility. Plot files have the file extension .MPLT (an abbreviation of Mcs PLoT). The figure below shows the static effective tension distribution in the outer pipe (this corresponds to the file Static.S1.mplt, or similar, depending on your naming convention). You can examine the other plots created for the static analysis at your convenience.
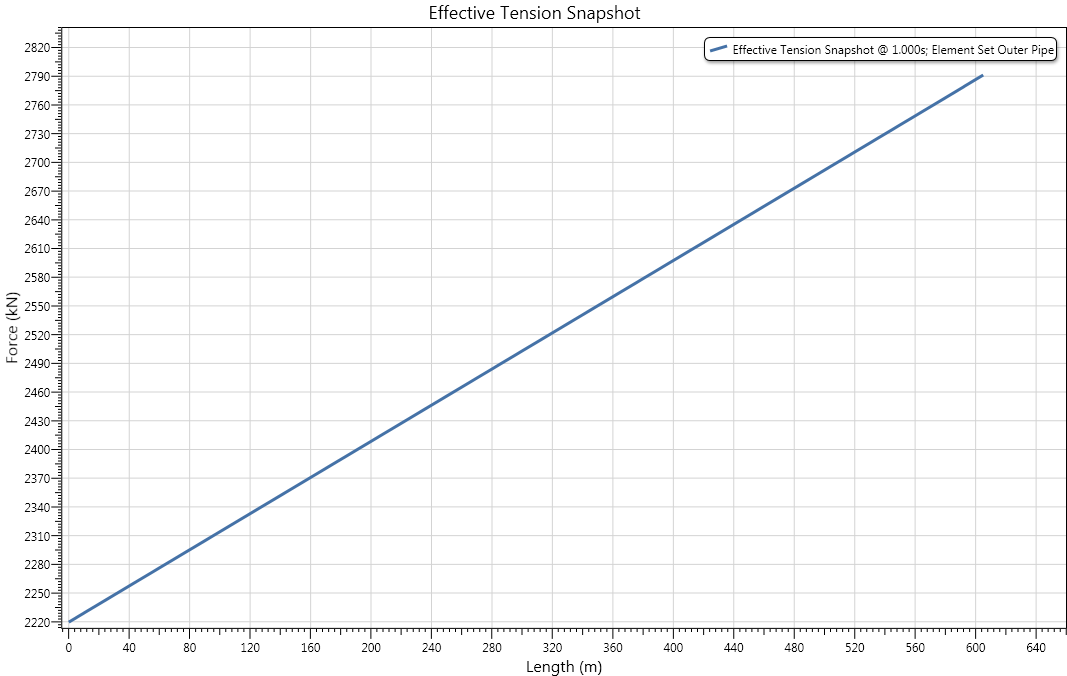
Static Effective Tension Distribution in Outer Pipe
Refer to Plotting for further information on this feature.
In addition to the standard postprocessing facilities available within Flexcom, the software is also accompanied by a dedicated Excel Add-In. This feature allows you to extract results from Flexcom database files directly into Excel. Its operation should be fairly self-explanatory, but sample spreadsheets are provided with the worked example for illustration purposes. Specifically, distributions of effective tension and bending moment are presented for the initial static analysis, while time dependent data is presented for one of the dynamic load cases.
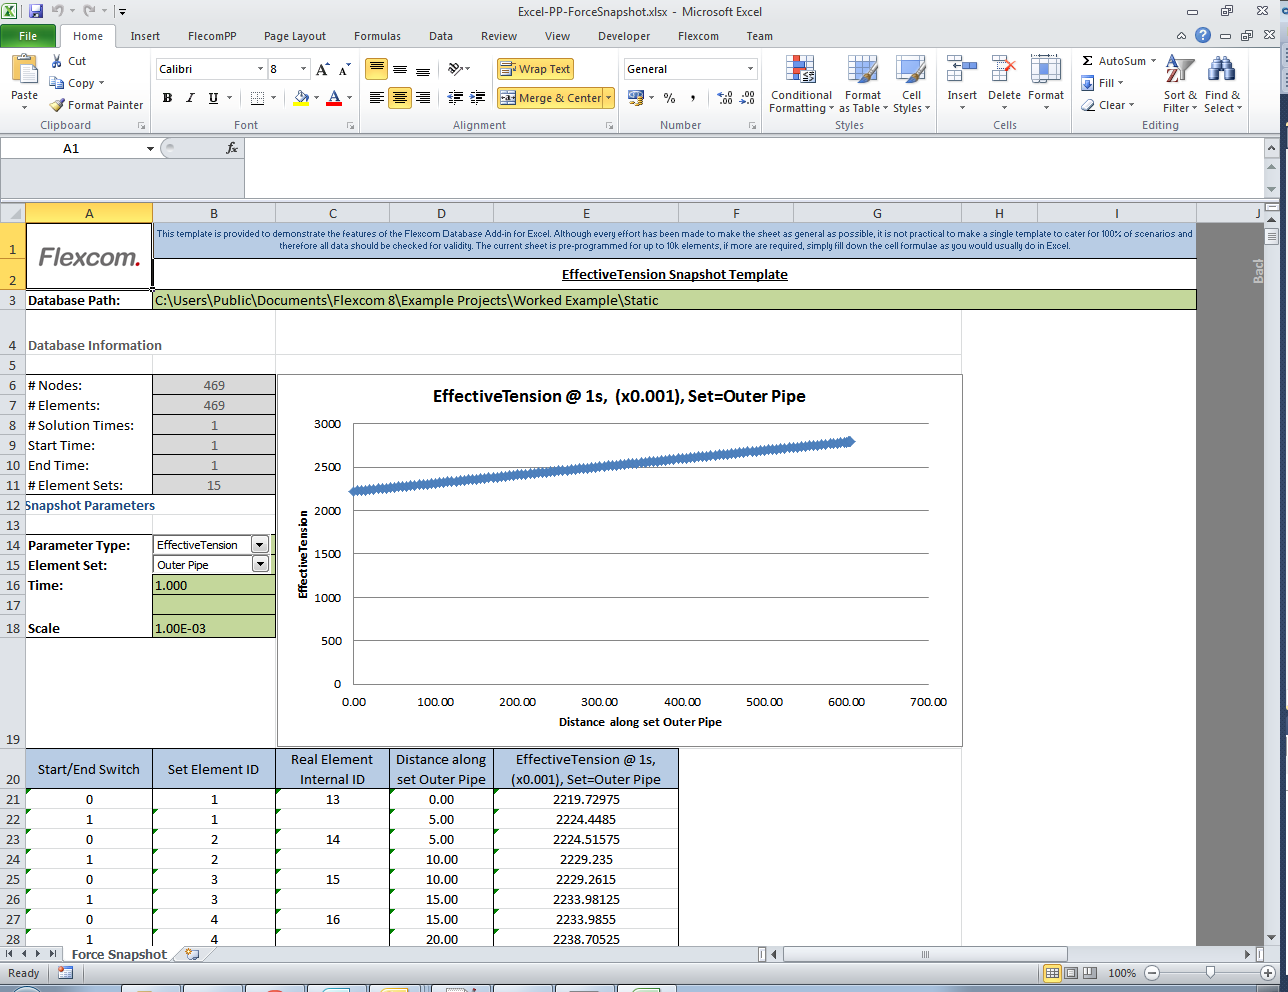
Excel Add-In
Refer to Excel Add-in for further information on this feature.