Control Element Colouring |
 
|
Control Element Colouring |
|
By default, elements in a Model View display are colour-coded by element set, element set in this context meaning the set an element is part for the specification of geometric properties. You can though also colour elements according to one of the program force or stress outputs, effectively producing a contour plot of the variable nominated. The Control Element Colouring option (![]() ) is used to invoke this feature.
) is used to invoke this feature.
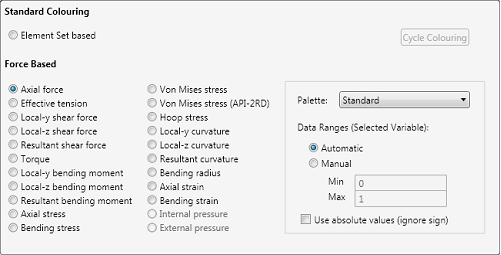
Control Element Colouring Inputs
This screen grab shows a drilling riser colour-coded by effective tension – note that horizontal displacements have also been magnified for visual effect.
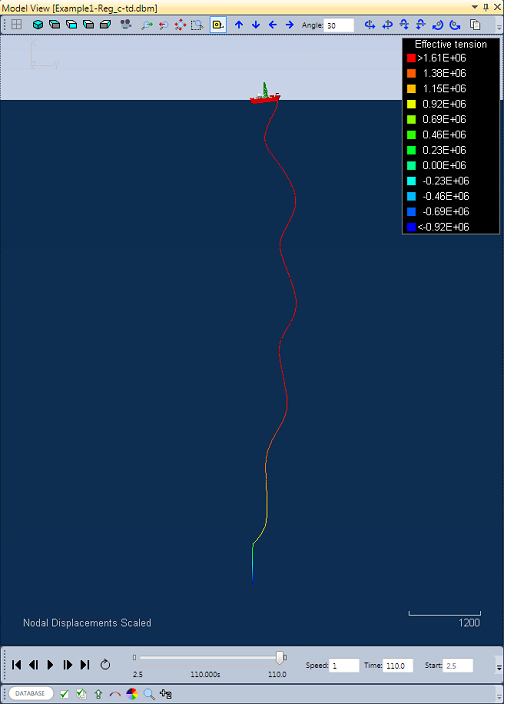
Sample Stress Contouring
By default, the data ranges are based on the maximum and minimum values experienced over the course of the finite element simulation. Occasionally, the default ranges may be unsuitable. For example...
•If the model contains some rigid elements of extreme stiffness, then the bending moment ranges may be dominated by these elements, to the extent that the remainder of the model appears to experience very low levels of bending by comparison (i.e. the entire model may appear blue). In such circumstances, the Show/Hide Element Sets feature may be used to hide unwanted elements from the display, and the data ranges will automatically update to reflect the visible elements only.
•Some users may prefer not to display models which contain a lot of red colouring, in case the engineering results (e.g. effective or bending moment) are perceived as being excessive. If this is the case, the Data Ranges option may be switched from Automatic to Manual, and the Max value increased sufficiently high such that the most critical region of the model appears orange rather than red.