Deepwater Catenary Example |
 
|
Deepwater Catenary Example |
|
Design predictions of excess bending in the touchdown zone of deepwater catenary risers have been of concern in recent years. To illustrate the benefits of incorporating bending hysteresis effects in the global analysis, the analysis of a deepwater catenary is considered. The riser is a 6” production riser deployed from an FPSO in 705m of water, similar to the Free Hanging Catenary example from the standard Flexcom examples set. The hysteresis option is invoked by specifying an appropriate backbone curve as described above. The backbone curve used for this particular example is shown below.
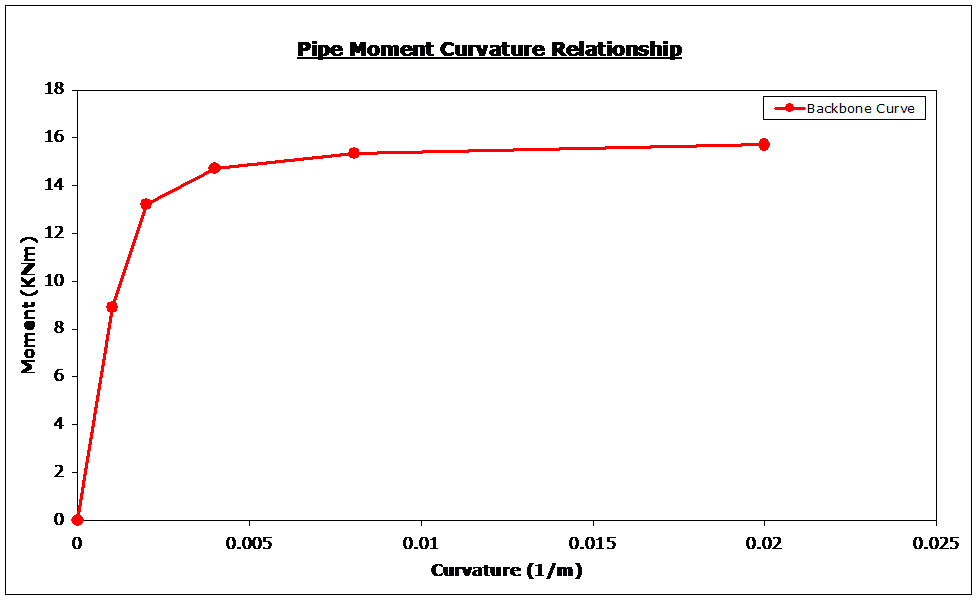
Hysteresis Backbone Curve for Deepwater Catenary
The wave loading applied to the riser system is a regular wave of amplitude 5m and period 14s. This represents an extreme condition at a benign offshore location. Bending curvatures in the touchdown zone and at the riser hang-off are compared with results obtained from a conventional linear elastic analysis.
The below figure compares the envelopes of effective tension for the linear elastic and non-linear hysteresis models. Significant compression occurs in the riser in both cases, with the level of compression increased in the hysteresis case.

Effective Tension Envelope
The following two figures compare envelopes of curvature at the riser hang-off point and in the riser touchdown zone respectively. The touchdown curvatures based on the linear elastic bending exceed design requirements in several locations. In contrast, curvatures based on the hysteretic backbone curve give notably smaller touchdown and hang-off curvatures which would enable the riser design to pass.

Dynamic Curvature Envelope at Riser Hang-off
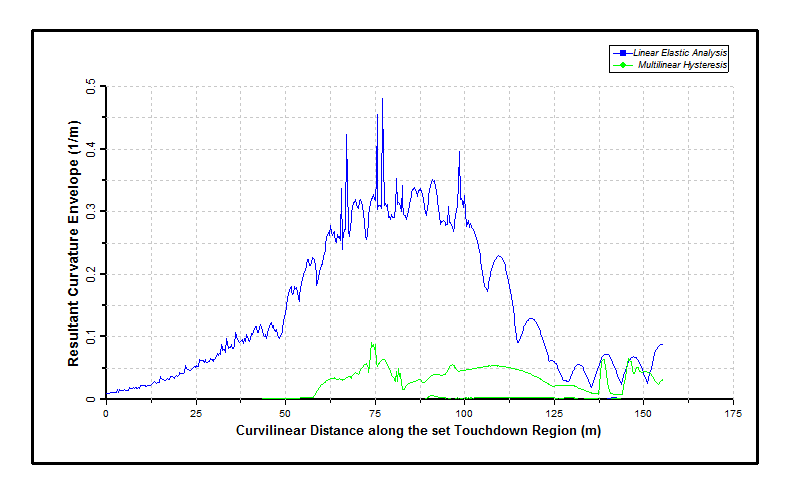
Dynamic Curvature Envelope in Touchdown Zone
The below figure shows a variable/variable plot of moments and curvatures at the hang off point. The plot demonstrates that the response is hysteretic.
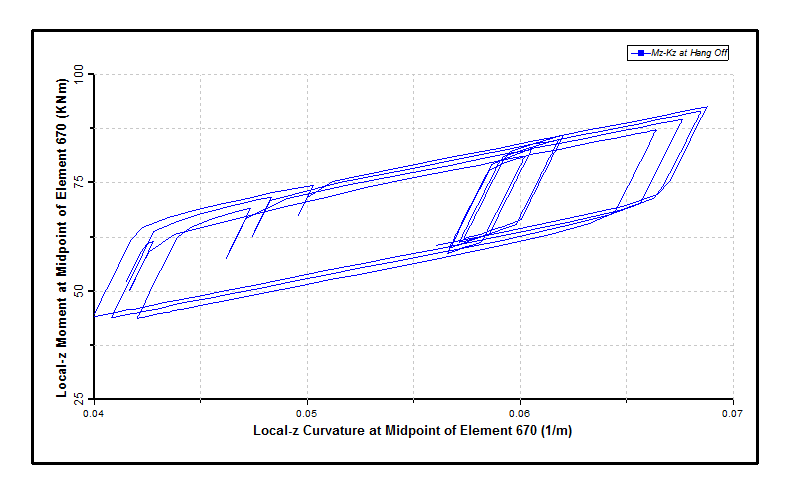
Moment-Curvature Response in Touchdown Zone