OC4 3.1 modified (control system test) |
 
|
OC4 3.1 modified (control system test) |
|
This load case is not part of OC4 Phase II. It was added here in order to verify the correct operation of the control system in Flexcom. Fundamentally it is very similar to OC4 P2 LC3.1, but the wind speed in this load case varies over the course of the simulation, allowing us to examine the behaviour of the turbine. For comparison purposes, results predicted by an equivalent simulation performed with FAST are also included.
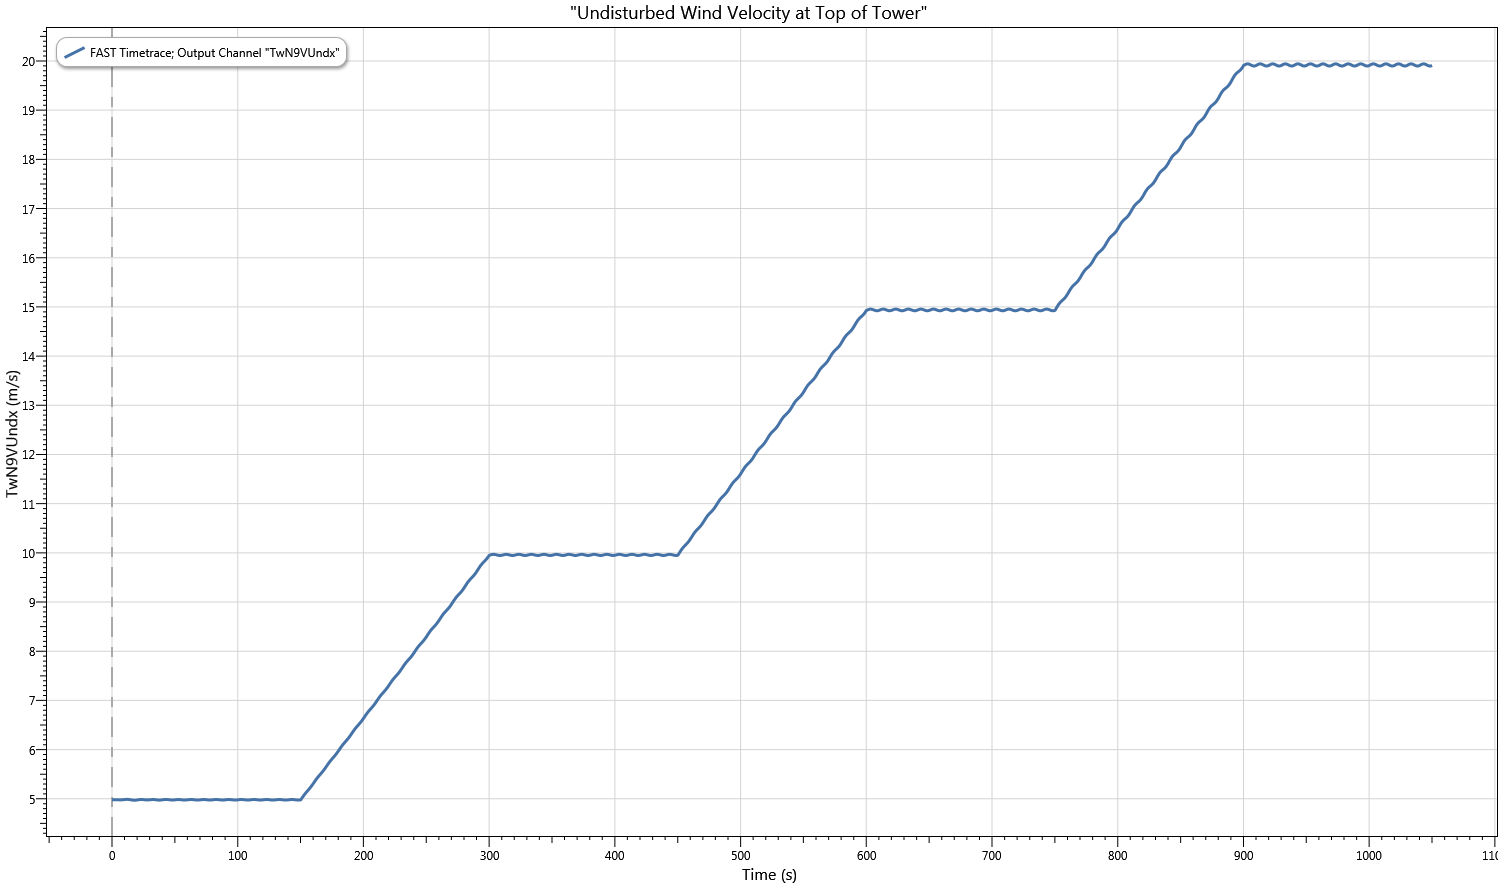
A variable wind speed definition is used in order to test the control system. The wind speed at the hub increases from 5m/s, to 10m/s, to 15m/s, and finally to to 20m/s.
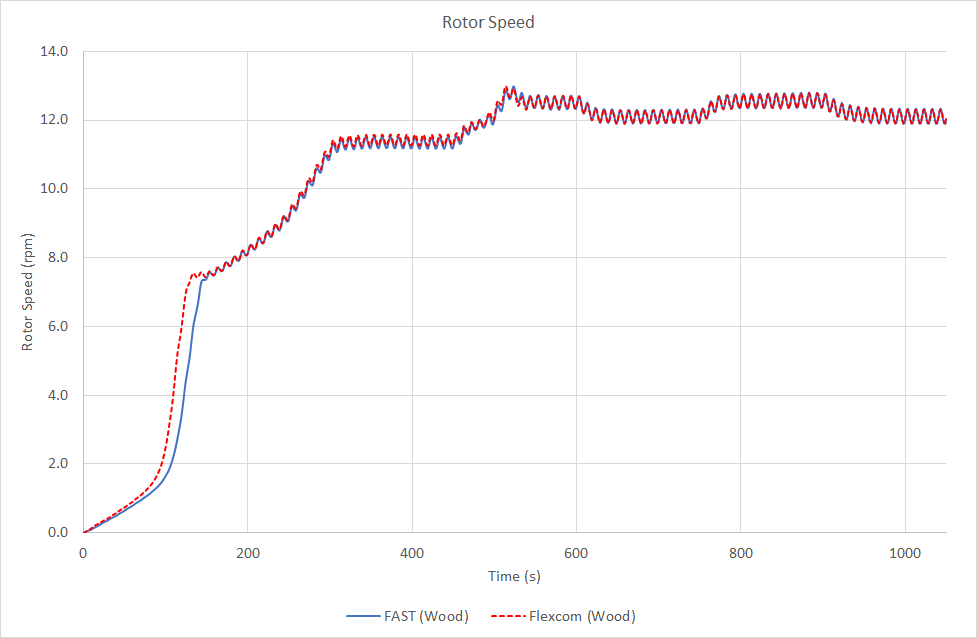
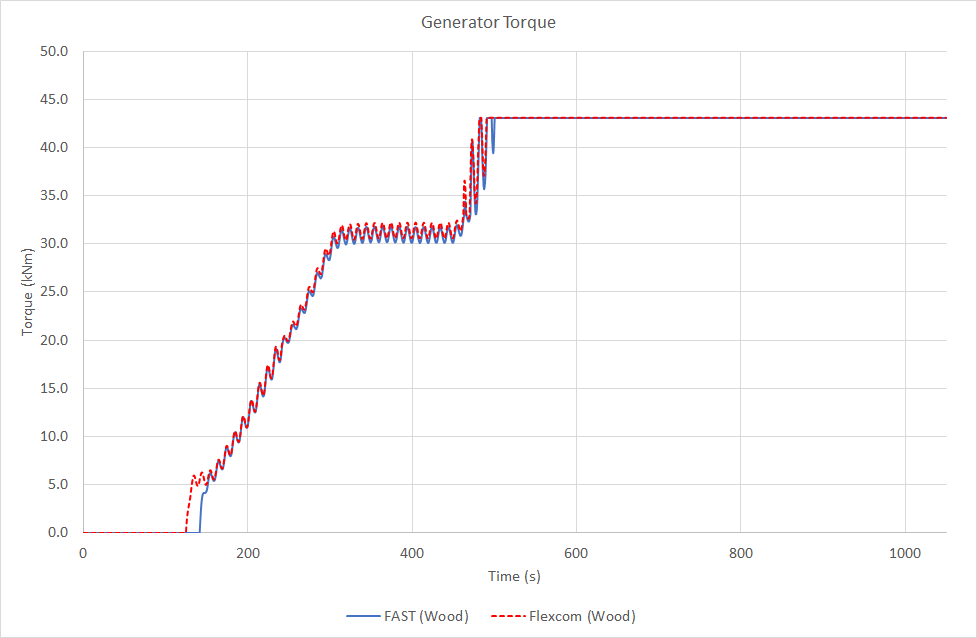
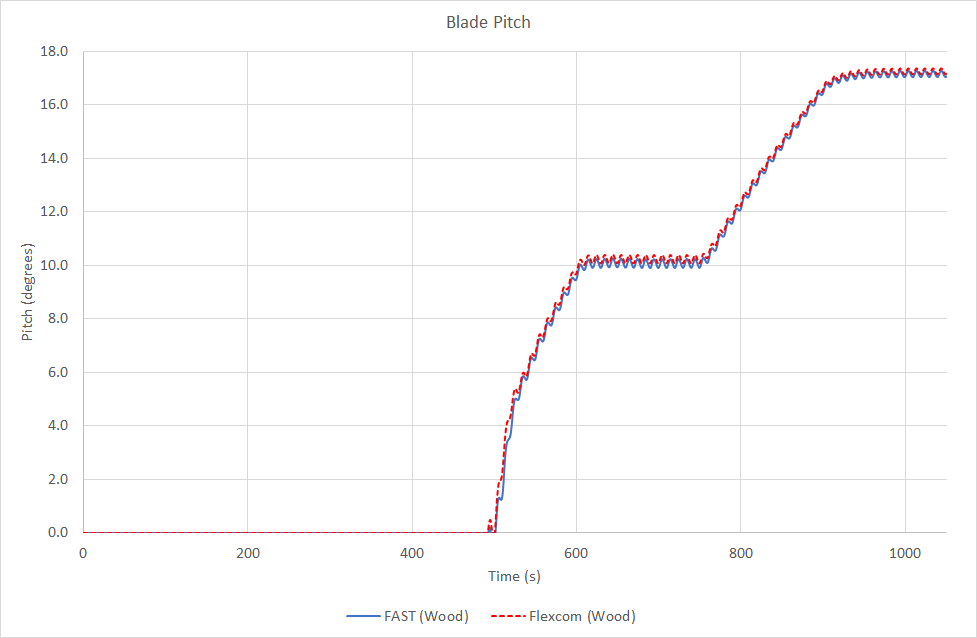
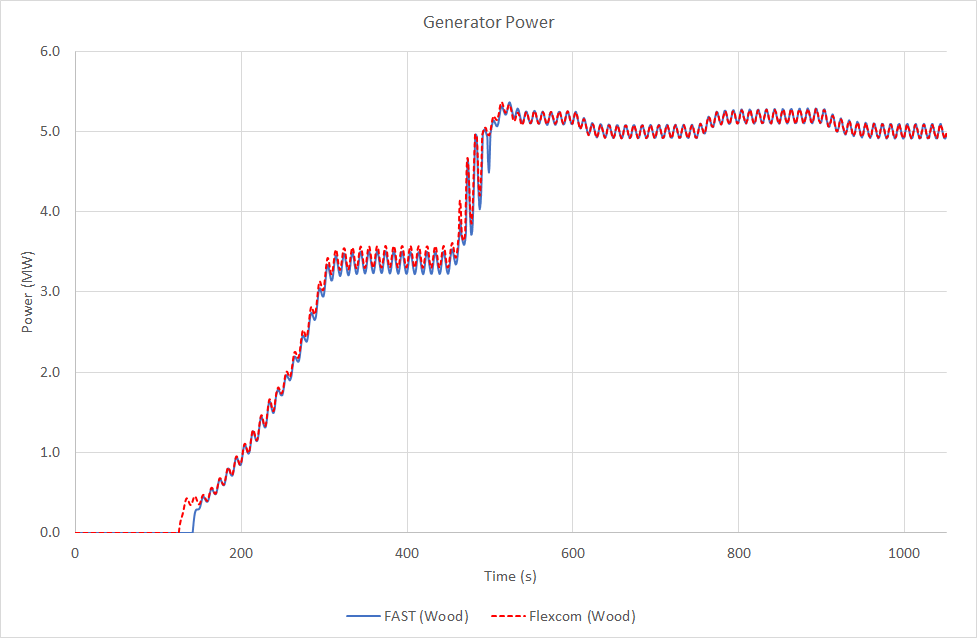
The following figures show the rotor speed, generator torque, blade pitch angle, and generator power. Very close agreement is demonstrated between Flexcom and FAST for all these key parameters.
At the beginning of the simulation, a low wind speed of 5m/s is applied, and the rotor speed quickly increases from its initial value of 0rpm. At approximately 60 seconds, the control system increases generator torque from 0kNm up to about 5.5kNm, the rotor speed reaches a steady state value of about 7.5rpm, and a small amount of generator power - about 0.4MW - is generated. These wind conditions (18kph/11mph) represent the cut-in phase of the turbine.
Between 150 seconds and 300 seconds, the wind speed is steadily increased from 5m/s to 10m/s. During the same period, the control system steadily increases generator torque to about 30.5kNm, the rotor speed steadily increases to about 11.3rpm, and the generator power increases to about 3.4MW.
Between 300 seconds and 450 seconds, the wind speed is held constant at 10m/s, with all parameters hovering around mean steady-state values (torque ~30.5kNm, rotor speed ~11.3rpm, generator power ~3.4MW). Some minor fluctuations are caused by the wave induced motions of the platform, which change the tower pitch angle periodically, and affect the aerodynamic loading on the turbine. These wind conditions (36kph/22mph) keep the turbine operating below rated power.
Between 450 seconds and 600 seconds, the wind speed is steadily increased from 10m/s to 15m/s. During this transition, the control system initially increases generator torque to about 43kNm, and the rotor speed increases to about 12.5rpm. At this point, the generator power increases to about 5.2MW, which is above the rated power of the turbine, so the control system activates the pitch actuators. Between 500 seconds and 600 seconds, the blade pitch angle increases from 0 degrees to about 10 degrees. This helps to reduce the rotor speed to about 12.1rpm and limits the generated power to 5MW.
Between 600 seconds and 750 seconds, the wind speed is held constant at 15m/s, with all parameters hovering around mean steady-state values (torque ~43kNm, rotor speed ~12.1rpm, blade pitch ~10 degrees, generator power ~5MW). Again some minor fluctuations are caused by the wave induced motions of the platform. The control system keeps the turbine operating at rated power under these wind conditions (54kph/33mph).
Between 750 seconds and 900 seconds, the wind speed is steadily increased from 15m/s to 20m/s. As the turbine is already operating at rated power, the generator torque remains at 43kNm, while the control system further pitches the blades to about 17 degrees. The rotor speed increases slightly to about 12.5rpm, and the generator power increases to about 5.2MW (slightly above rated), as there is naturally a slight time delay between the control and the response. It should be noted also that the wind time history used in this example is intended for illustrative purposes only - an increase in mean wind speed of 36kph over just 2.5 minutes would not be experienced in reality.
Between 900 seconds and 1050 seconds, the wind speed is held constant at 20m/s, with all parameters hovering around mean steady-state values (torque ~43kNm, rotor speed ~12.1rpm, blade pitch ~17 degrees, generator power ~5MW). Again some minor fluctuations are caused by the wave induced motions of the platform. The control system keeps the turbine operating at rated power under these wind conditions (72kph/44mph).
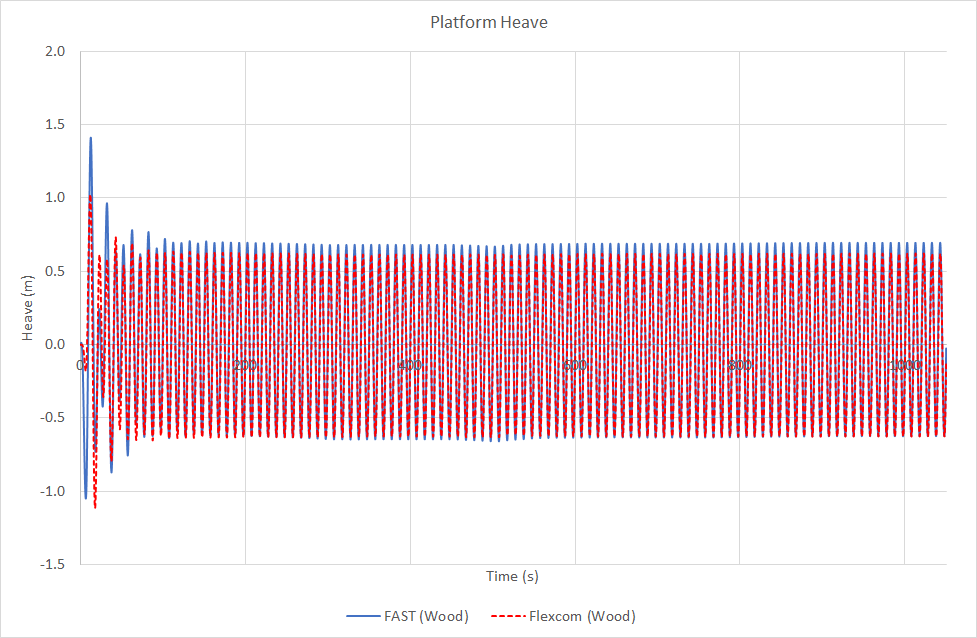
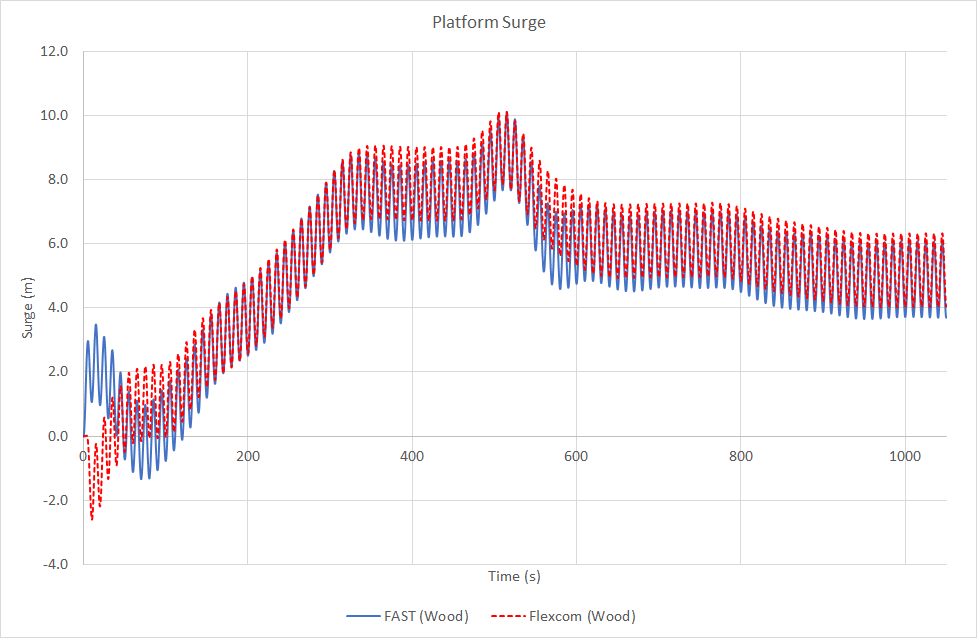
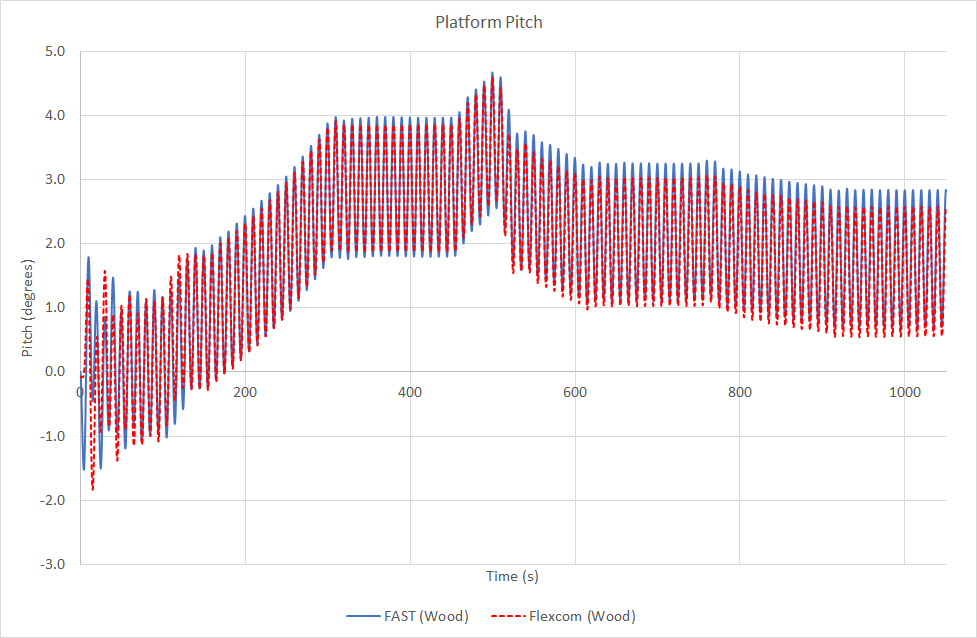
The following figures show the platform responses in heave, surge and pitch. Close agreement is demonstrated between Flexcom and FAST.
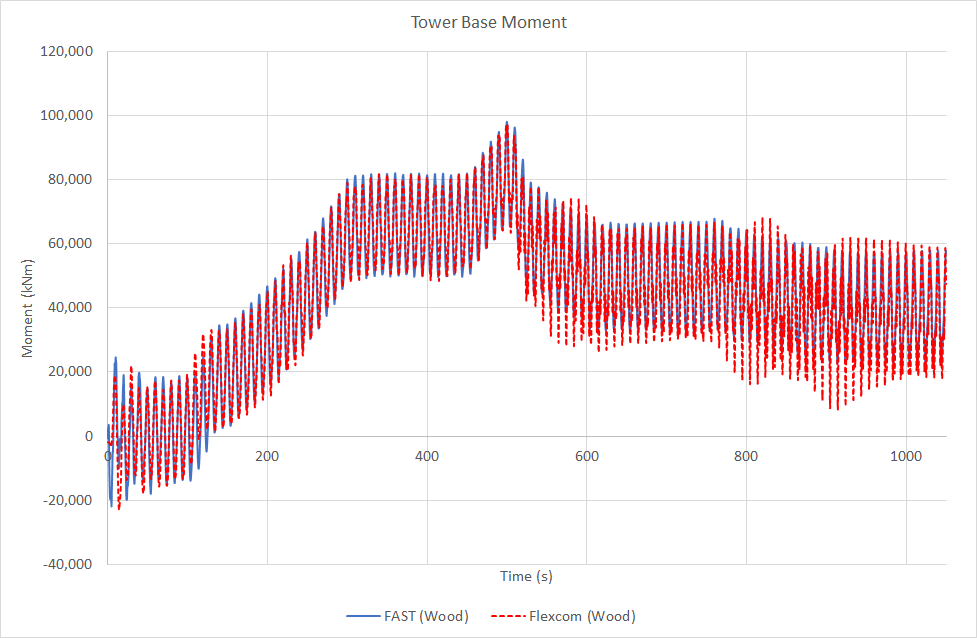
Reasonable agreement is demonstrated between Flexcom and FAST for bending moment at the base of the tower.
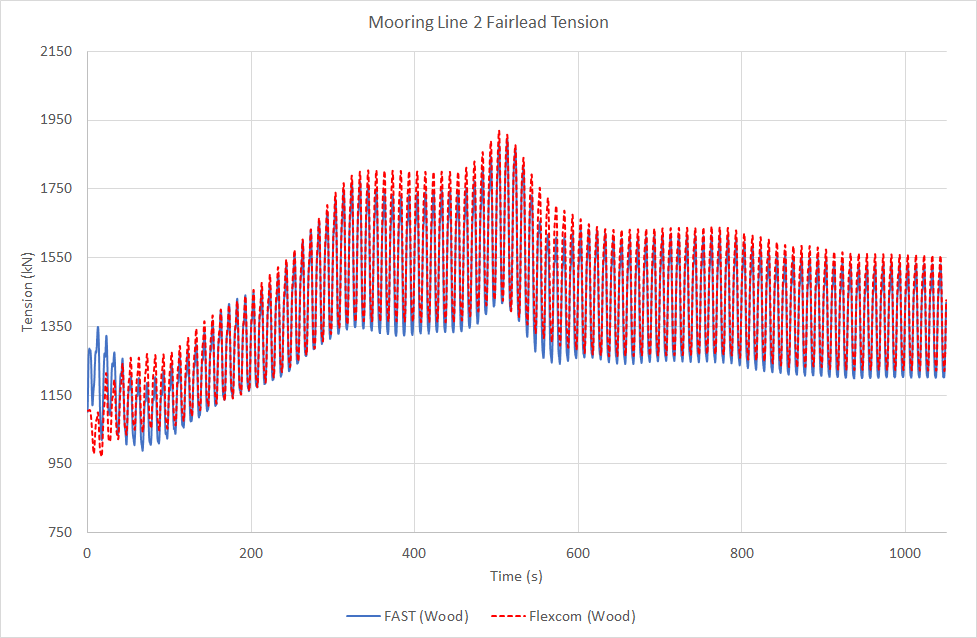
Close agreement is demonstrated between Flexcom and FAST for the fairlead tension in mooring line no.2 (the mooring which is aligned with the wind and wave loading). While the mean value is slightly different, due to a difference in mean surge, the dynamic variations about the means are very similar.