OC4 P2 LC2.4 Current and regular waves |
 
|
OC4 P2 LC2.4 Current and regular waves |
|
This load case combines elements from OC4 P2 LC2.1 (which includes regular wave loading only) and OC4 P2 LC2.3 (which includes current loading only). Similar trends to that observed for these simpler load cases are also evident here. Note that results from FAST (NREL) were not found in the IEA Wind Task 30 results library, so we have used results from FAST (Goldwind) instead in this comparison.
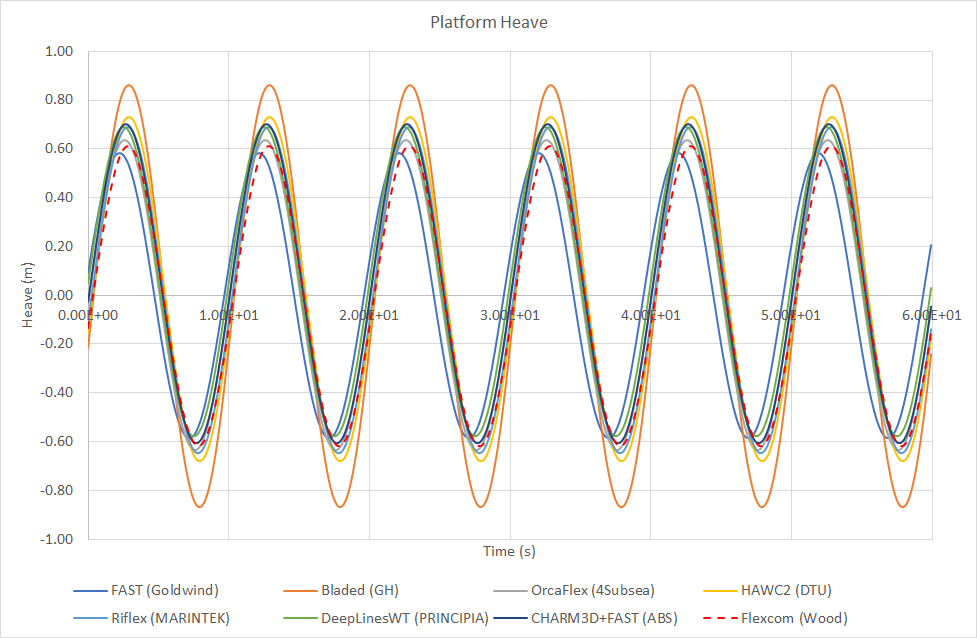
Flexcom's heave response shows close agreement with the other software tools, in terms of response amplitude, period and phase. Results from Bladed (GH) results show a heave response which is slightly larger than the other software tools.
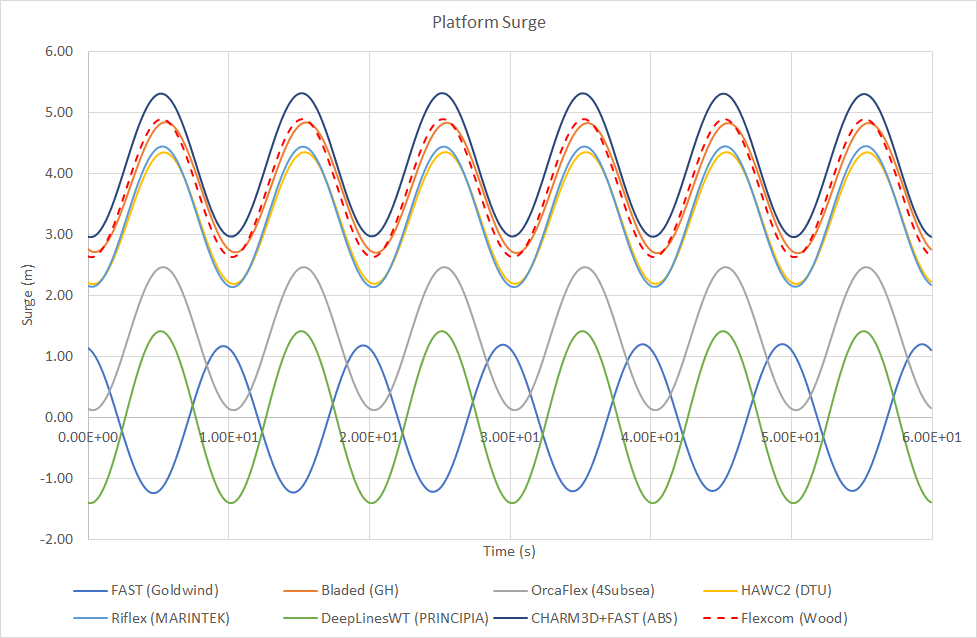
The surge response shows considerable variation across the different software products. Some of this may be attributed to the modelling of drift forces (refer to OC4 P2 LC2.1 for further information). Note however that results from FAST (Goldwind), Orcaflex (4Subsea) and DeepLinesWT (Principia) show a mean surge position which is lower than the other software tools. So there is a clear discrepancy between two groups of software in how mean surge is computed when both wave and current loads are included, as broadly speaking, surge motions showed reasonable agreement for waves only (OC4 P2 LC2.1) and current only (OC4 P2 LC2.3). This issue is not discussed in Robertson et al. (2014) and it is unclear as to what is causing it.
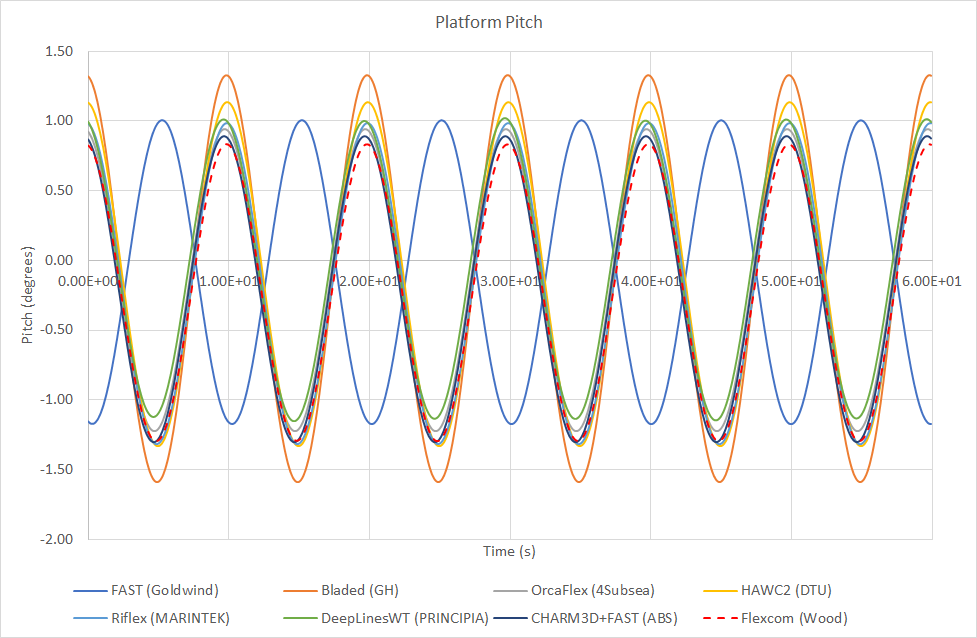
Flexcom's pitch response shows close agreement with the other software tools, in terms of response amplitude, period and phase. Results from Bladed (GH) show a pitch response which is slightly larger than the other software tools. Results from FAST (NREL) appear out of phase with the other tools, although this discrepancy is most likely caused by an inconsistency in presentation only.
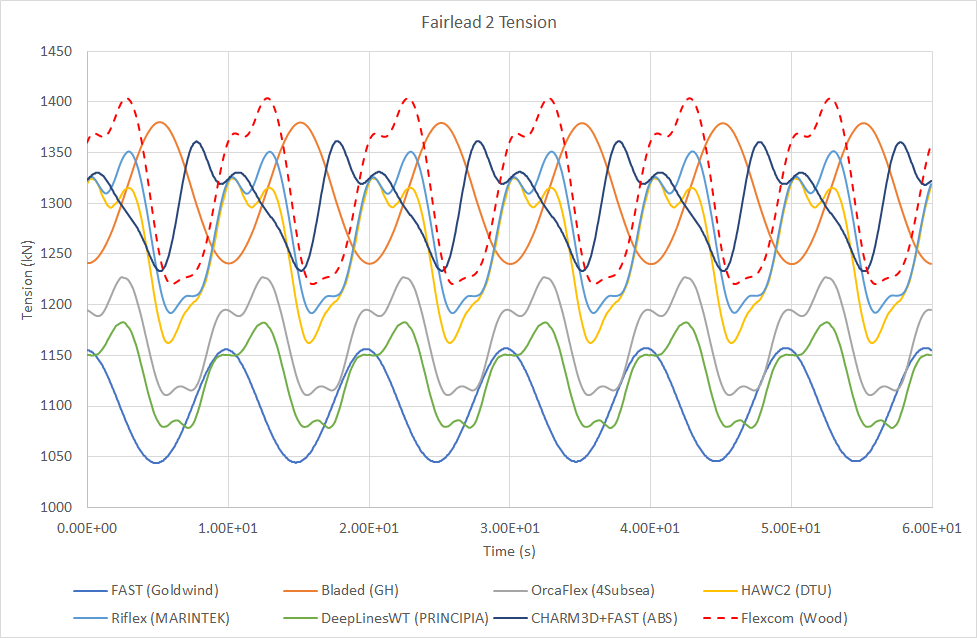
The fairlead tension shows considerable variation across the different software products, consistent with the discrepancies in surge discussed above. The fairlead tension predicted by Flexcom is at the upper bound of the software tools, a trend which is consistent with the surge response shown above. Differences in mooring line modelling approaches (as mentioned in OC4 P2 LC2.1) also contribute to tension variations.