Modal Analysis |
 
|
Modal Analysis |
|
The table below presents the natural frequencies of the SCR for the first 20 modes. For an SCR, the division of bending modes into In-Plane and Out of Plane modes is a relatively straightforward operation. For In-Plane modes, displacements occur only in the plane of the SCR. Likewise Out of Plane modes have displacements normal to the initial plane of the SCR only. Any mode combining motions in all three directions is deemed Unknown.
Riser Natural Frequencies
Mode No. |
Period (s) |
Type |
1 |
45.98 |
Out of Plane |
2 |
27.43 |
In-Plane |
3 |
23.20 |
Out of Plane |
4 |
16.97 |
In-Plane |
5 |
15.50 |
Out of Plane |
6 |
12.12 |
In-Plane |
7 |
11.63 |
Out of Plane |
8 |
9.62 |
In-Plane |
9 |
9.30 |
Out of Plane |
10 |
7.91 |
In-Plane |
11 |
7.75 |
Out of Plane |
12 |
6.77 |
In-Plane |
13 |
6.64 |
Out of Plane |
14 |
5.88 |
In-Plane |
15 |
5.80 |
Out of Plane |
16 |
5.22 |
In-Plane |
17 |
5.15 |
Out of Plane |
18 |
4.68 |
In-Plane |
19 |
4.63 |
Out of Plane |
20 |
4.25 |
In-Plane |
The two figures below plot maximum curvature as a function of mode number for the in-plane and out of plane bending modes respectively (these plots are generated automatically by Modes). This type of plot is created to help in identifying so-called ‘mixed modes’ (refer to Modal Analysis for further information), where mixed modes tend to appear as local maxima or spikes. The maximum modal curvature should be monotonically increasing with mode number if pure bending modes only are considered.
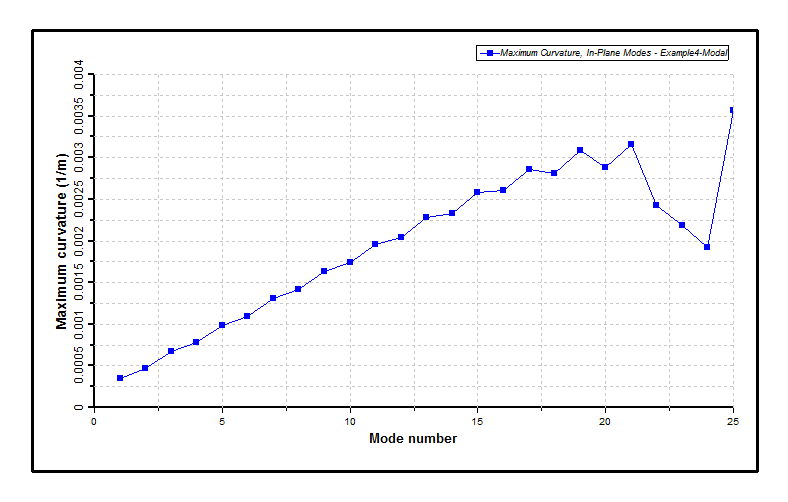
Maximum Curvatures, In-Plane Modes
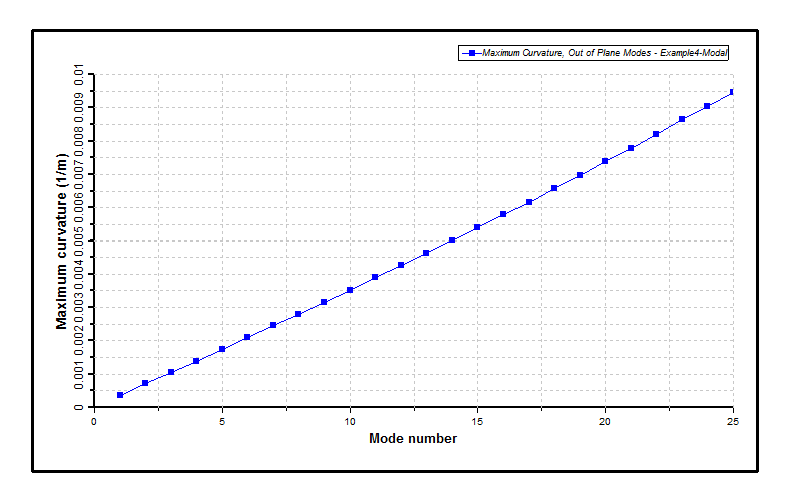
Maximum Curvatures, Out of Plane Modes
Some of the in-plane bending modes at the higher frequencies appear to be unreliable, as the monotonic trend is not followed. As it is difficult to clearly identify spikes in the plot, it is advisable to visually inspect the modal response manually. The procedure is relatively straightforward – you simply open two views of the structure on screen together. One should be a front elevation (i.e. a view normal to the plane of the SCR) and the other an end elevation (i.e. a view parallel to the plane of the SCR). Pure in-plane bending modes will be visible in the front elevation view, and pure out of plane bending modes will be visible in the end elevation view.
Additionally, if there are any combined axial-bending modes present, these will contain both bending deformation and axial deformation. In a pure bending mode, all of the nodes of the mode (as opposed to the nodes of the finite element model) will be stationary, so a standing wave effect will be exhibited. In a coupled axial-bending mode, there will be modal nodes which are not stationary, as there will be an axial response component present also. The figure below shows the modal response for the in-plane Mode No. 24. Standing wave behaviour is exhibited towards the top of the riser, but there are no stationary nodes in touchdown region, so clearly there is some axial response present.
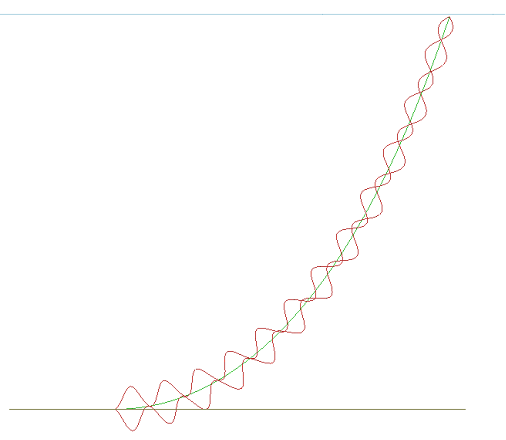
Modal Response for In-Plane Mode No. 24
Based on the above, some modes may be excluded from the Shear 7 output by invoking the SCR Modes – Exclude In-Plane option, and the modal analysis may be performed again. As the objective this time is to recreate the Shear7 output only (a purely postprocessing option), the Repeat Run capability is utilised. This facility allows you to indicate that you do not want the program to redo the full eigensolution. Instead the program is to read the eigensolution details from an earlier run, but to recalculate the Shear7 data, in this case with certain modes excluded. Note that a Repeat Run is practically instantaneous, as only postprocessing operations are performed. The figure below plots maximum in-plane curvature as a function of mode number, with some mixed modes excluded. The maximum curvature is now monotonically increasing with mode number, suggesting that only pure bending modes are now included in this output. Note also that although the excluded modes are not plotted anymore, the mode numbering remains unchanged; so if it is necessary to exclude further modes, it is still the ‘original’ mode numbers that are used.
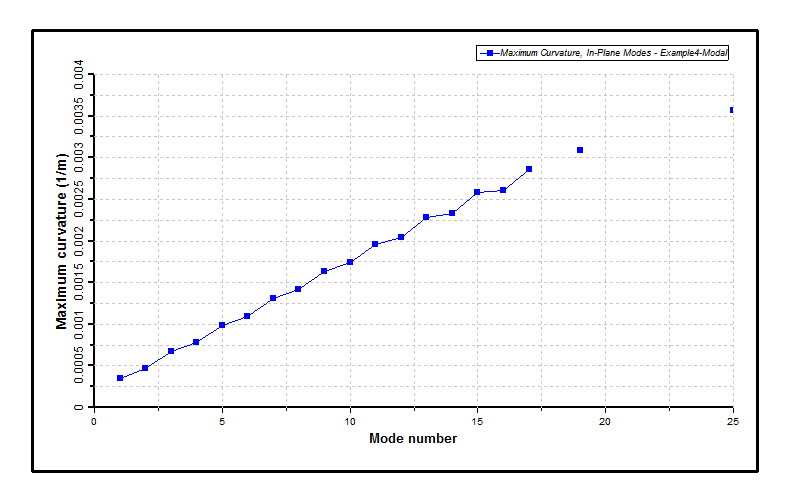
Maximum Curvatures, In-Plane Modes, Excluding Mixed Modes
The two figures below are graphs produced in Excel from tabular output presented in the output file. They plot the maximum in-plane and out of plane curvatures in each mode of the eigensolution, comparing the results at the element integration points, and the equal length segments used in the creation of Shear7 output. The intention here is to allow you to decide if you have specified enough segments to accurately capture the actual modal curvature distribution. In the present case the two sources agree reasonably well, so the specified number of segments appears reasonable.
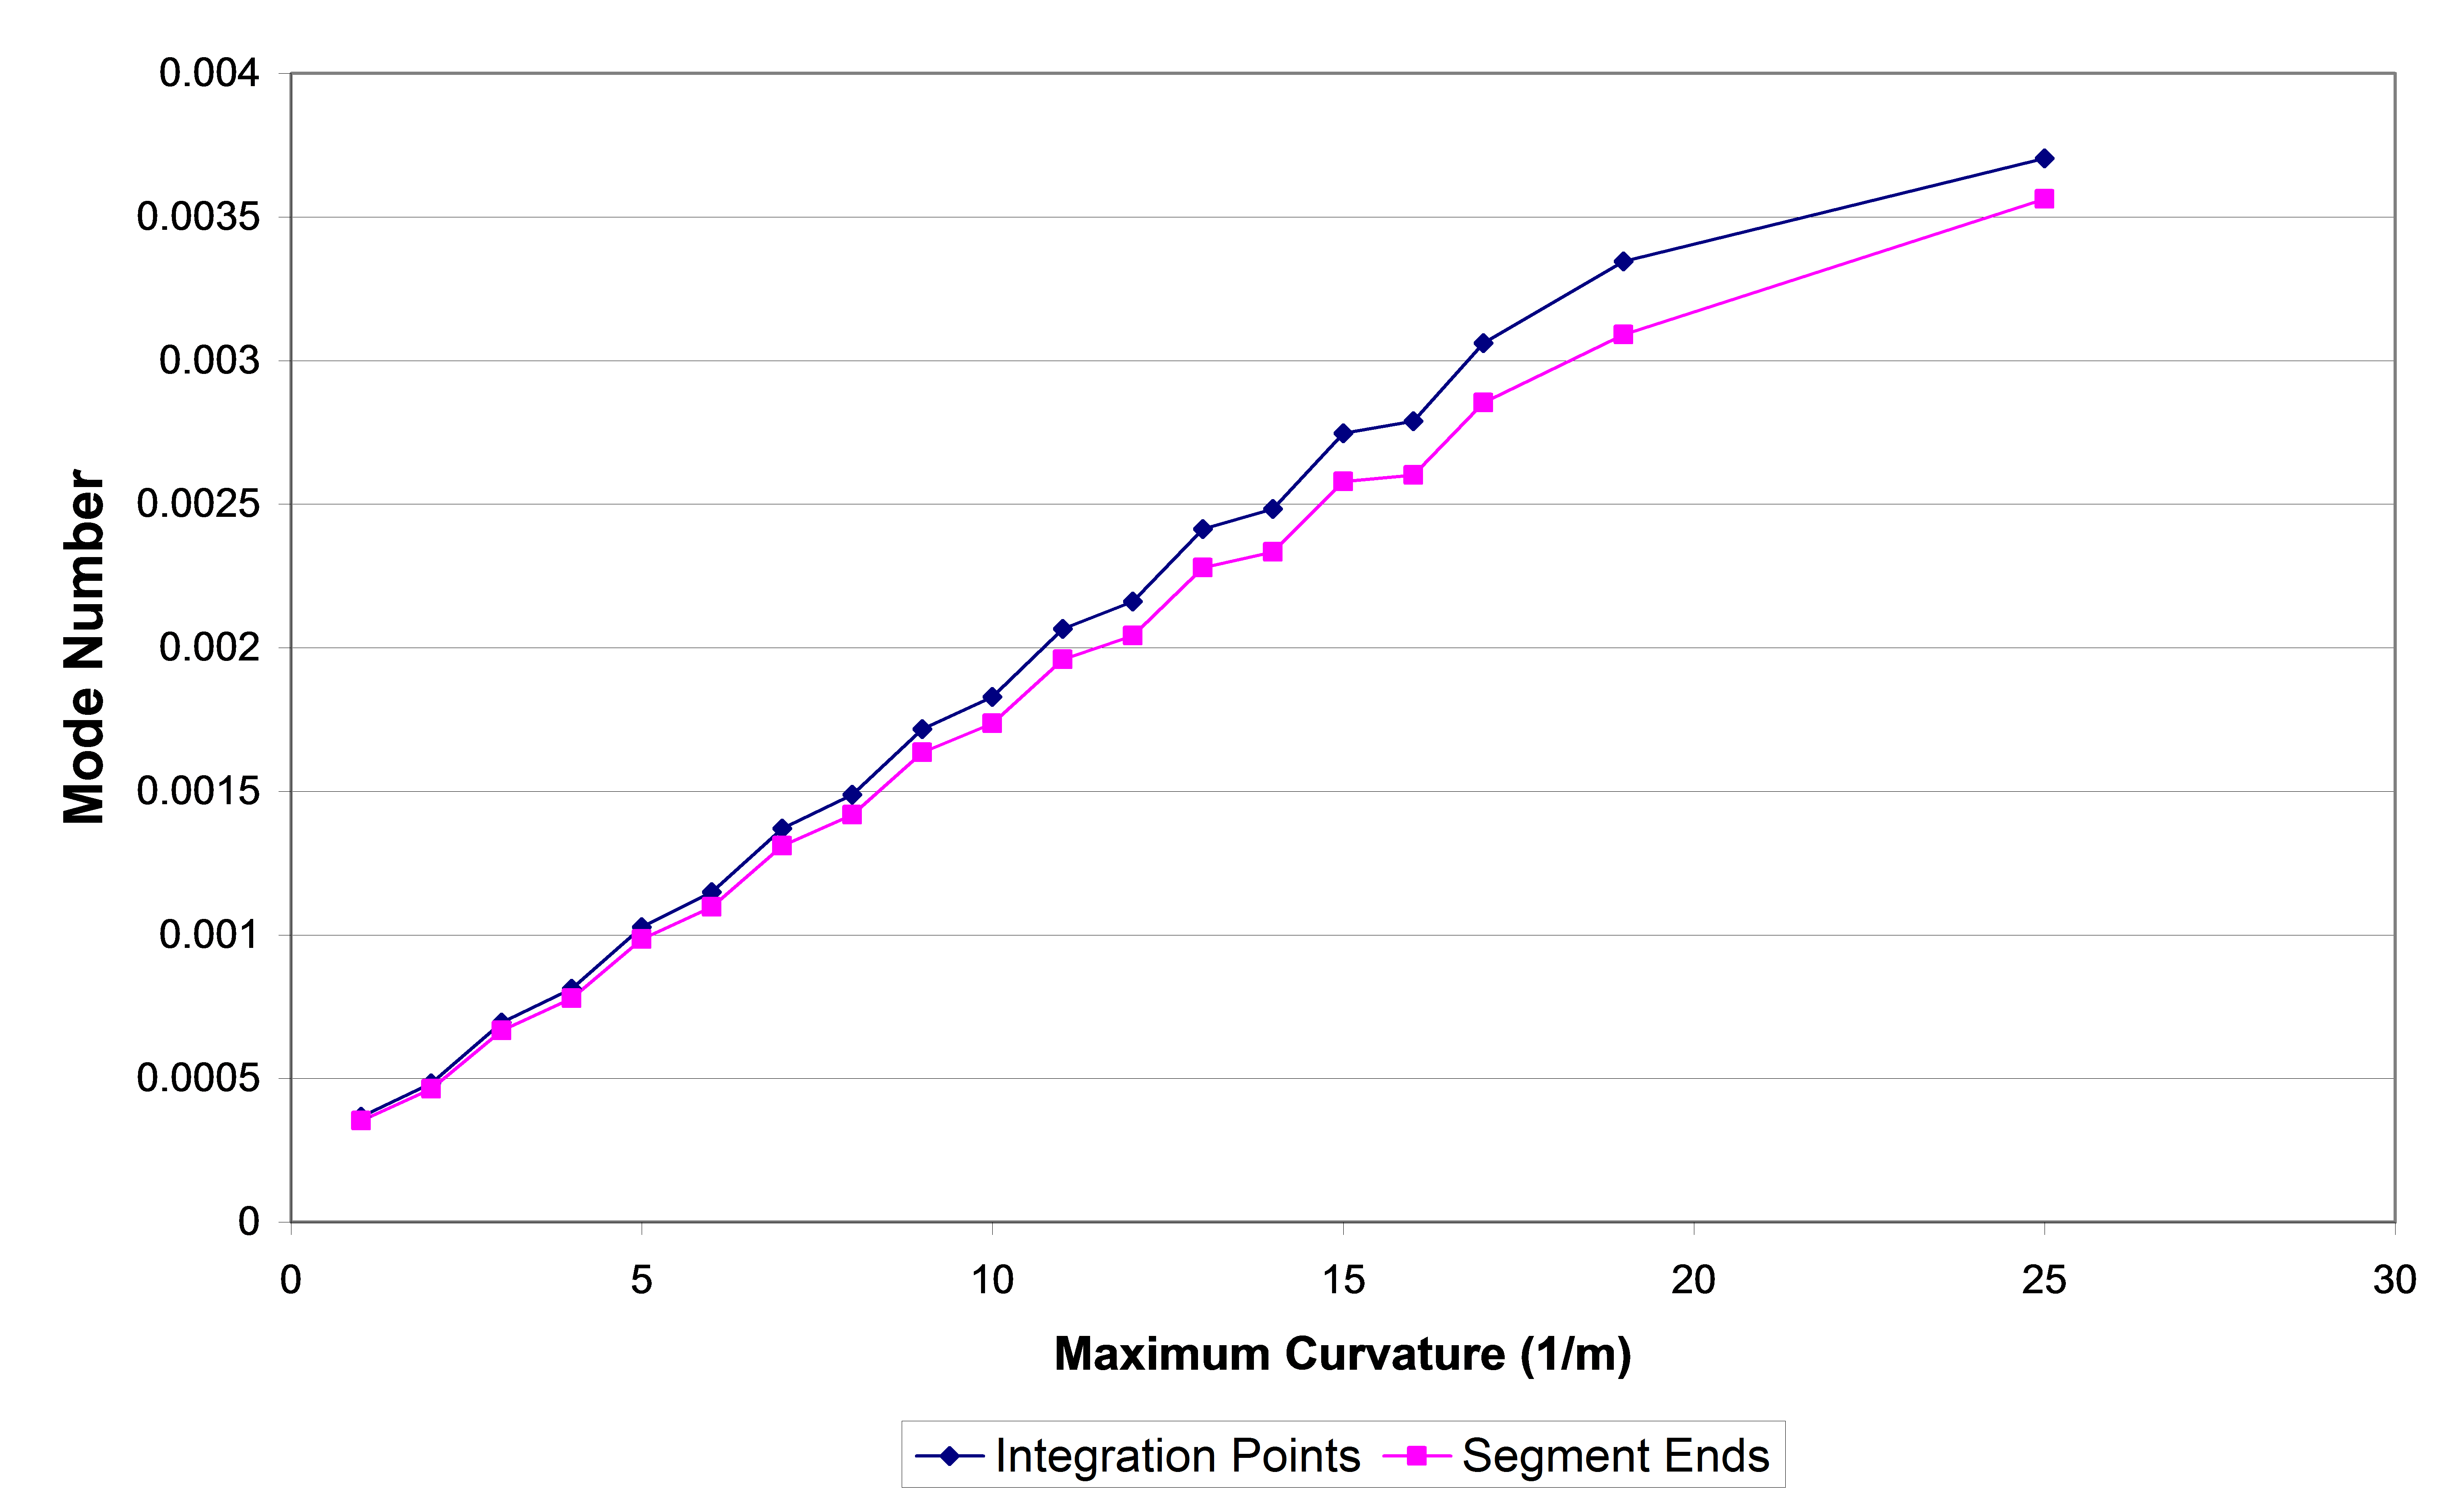
Maximum Curvatures, In-Plane Modes, Examining Segments
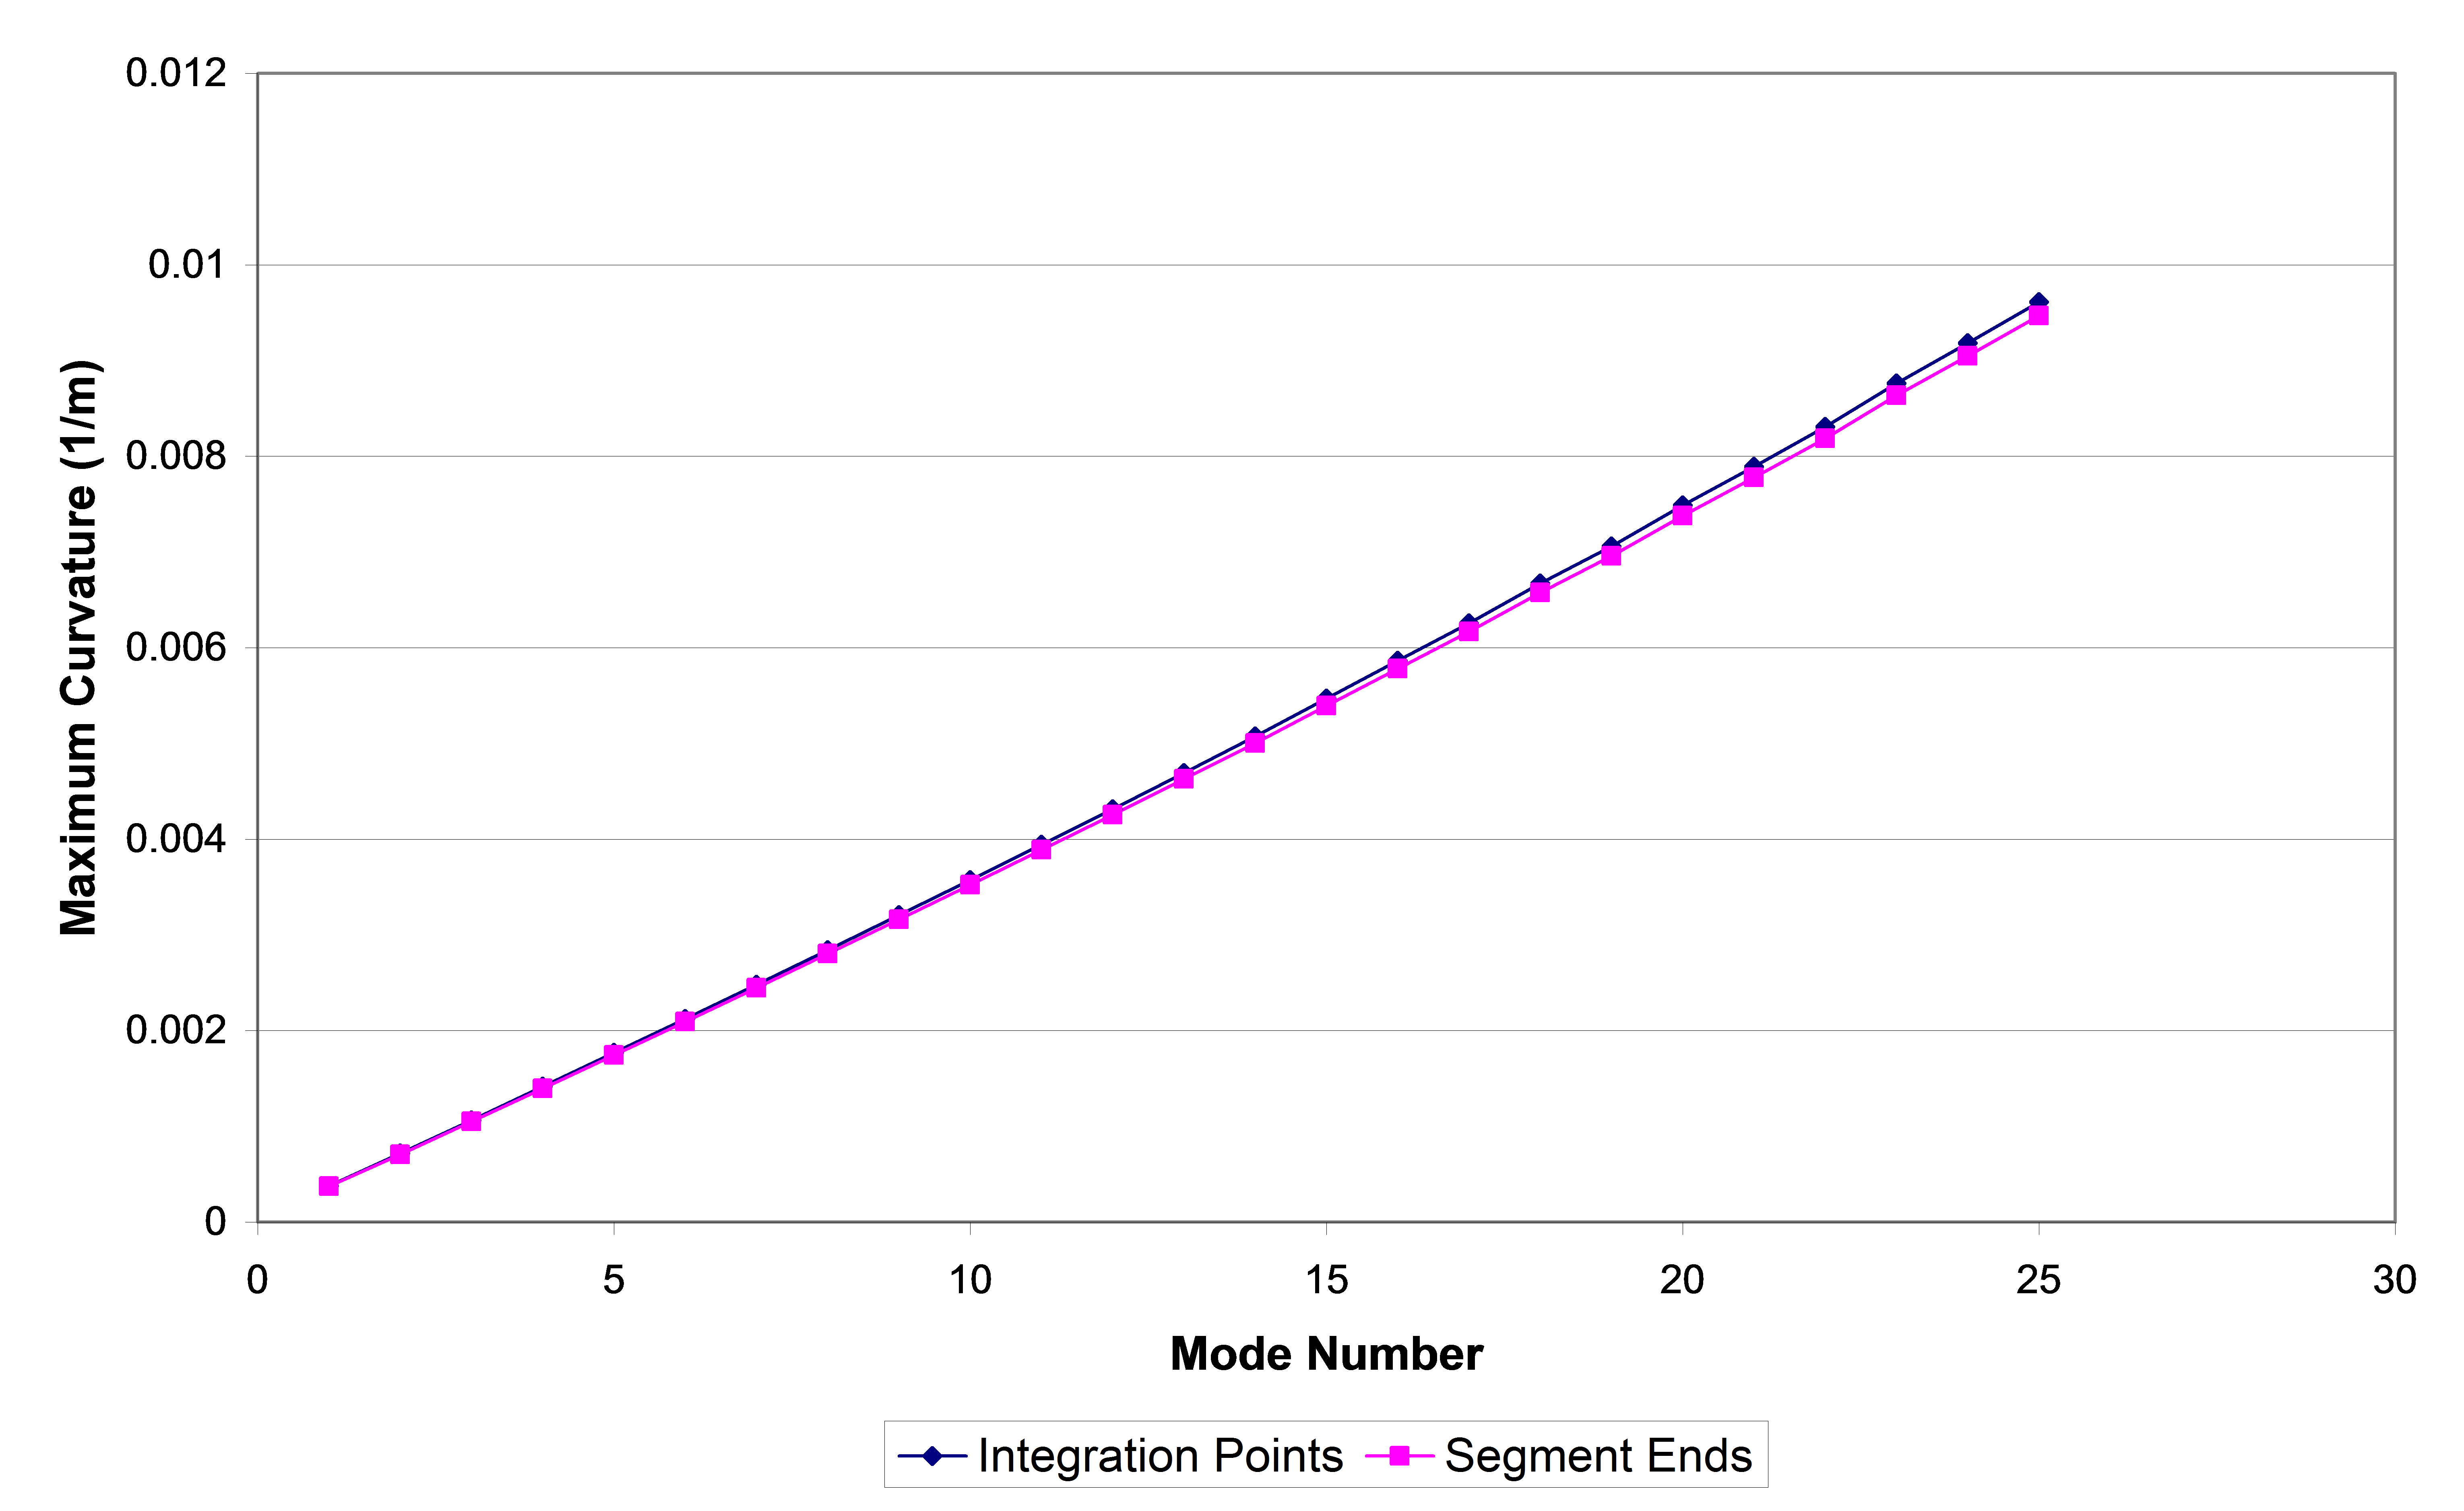
Maximum Curvatures, Out of Plane Modes, Examining Segments