Results |
 
|
Results |
|
The first figure shows the static bending moment distribution in the spool. The highest moments tend to occur at each end due to the applied fixations and the self-weight of the structure.
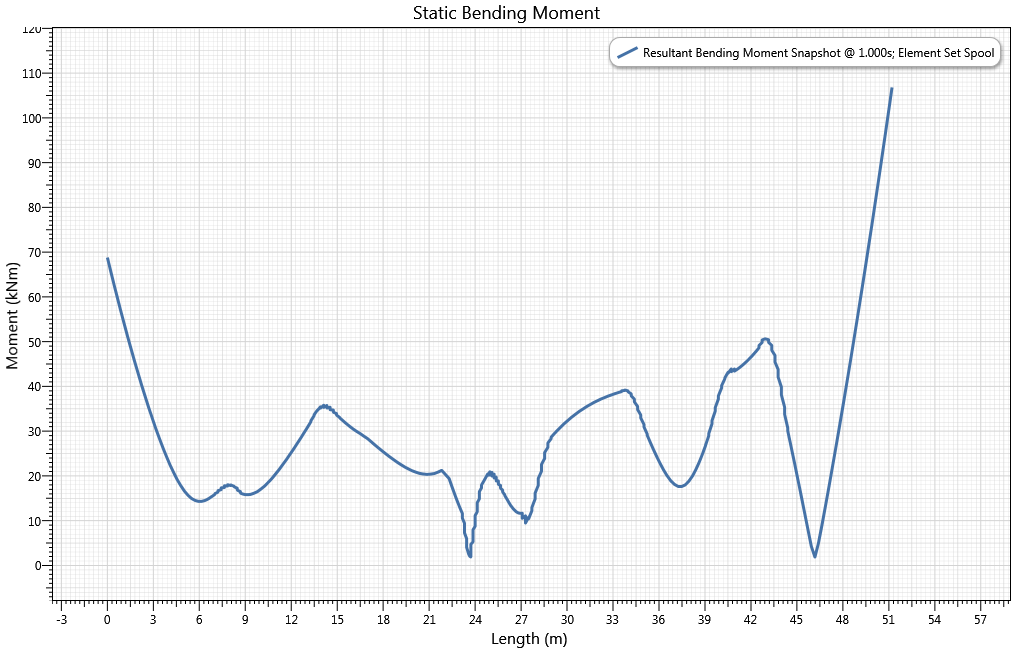
Static Bending Moment
The second figure shows the bending moment envelope throughout the spool model during the dynamic analysis. Significant bending moment variations are evident at all locations.
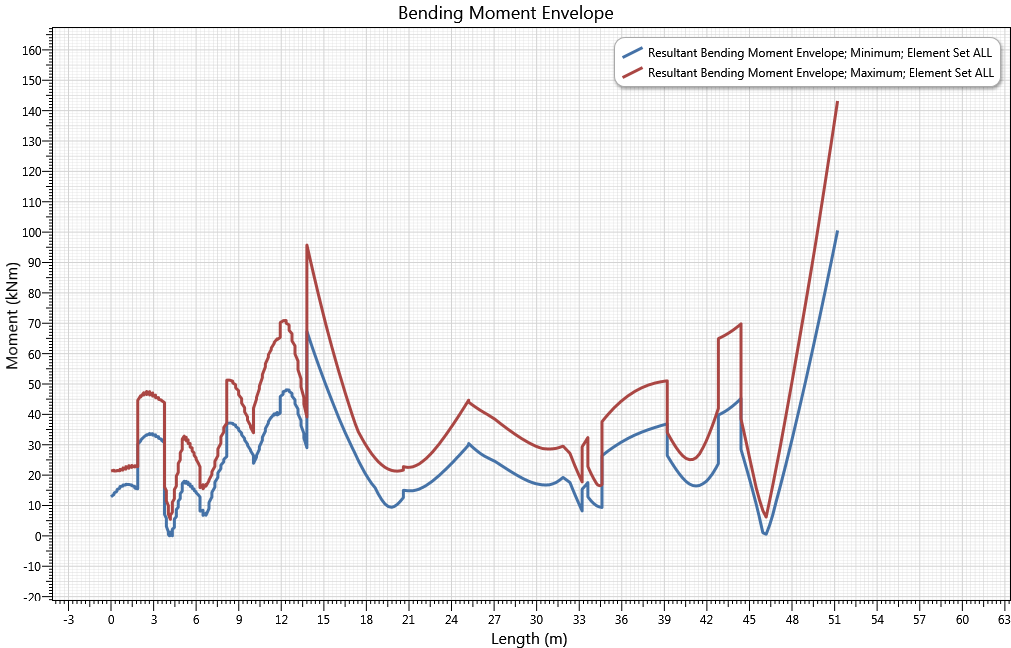
Dynamic Bending Moment Envelope
The next two figures below show time histories of the bending moment at either end of the spool. Elevated moments tend to coincide with the times when the entire slug is present in the model, and when it is positioned nearest to one of the ends.
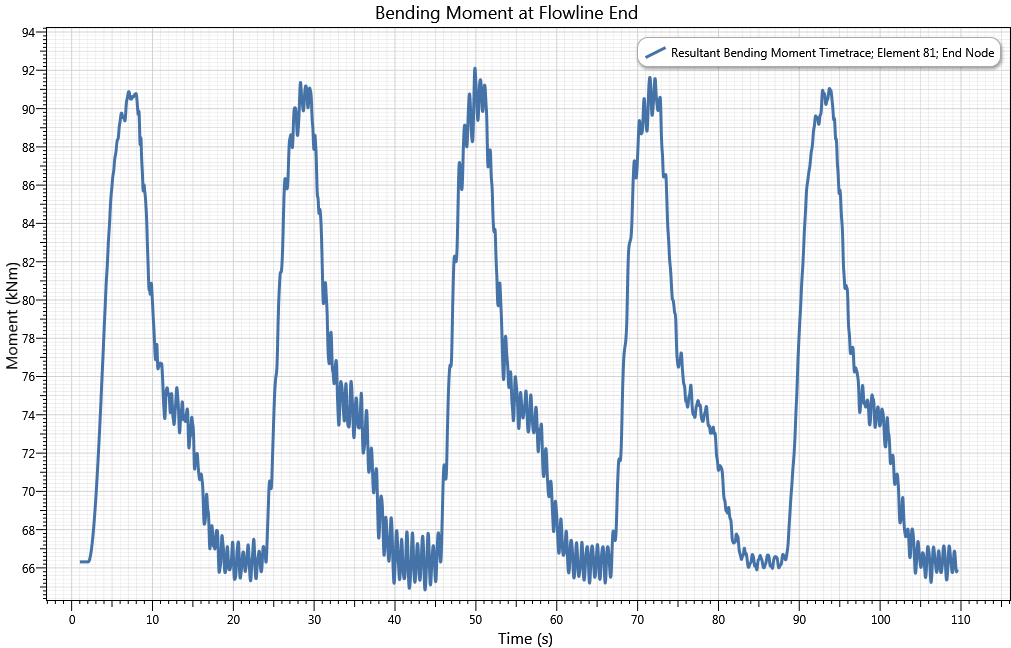
Bending Moment (Flowline End)
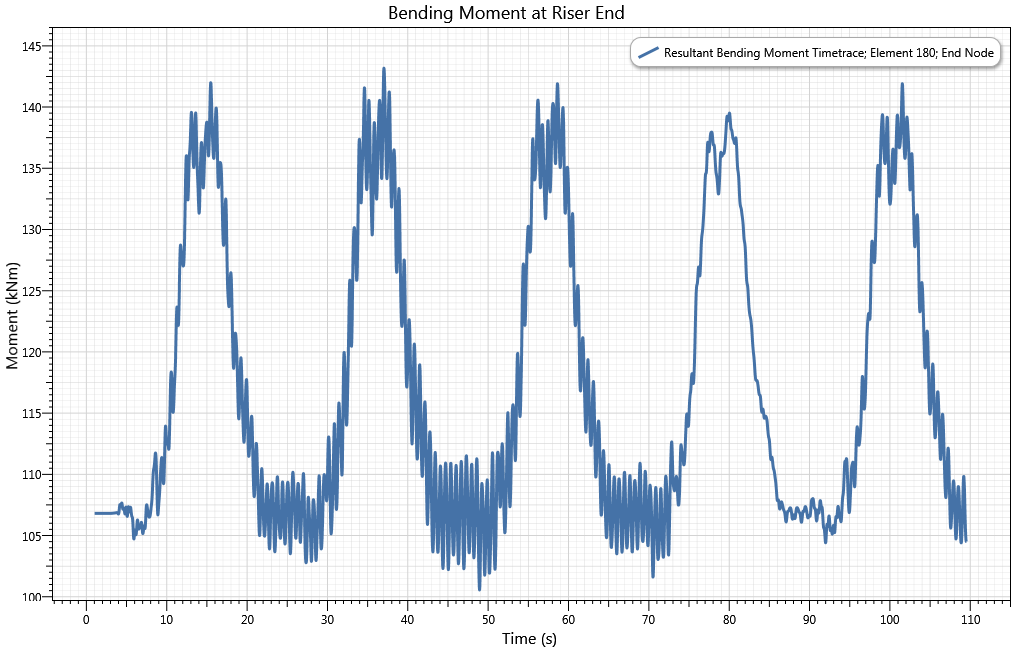
Bending Moment (Riser End)
The final figure shows time histories of the reaction forces at the support locations. Although both supports have similar elevations, the second support (the one nearest to the spool centre) bears about twice the load of the first one.

Support Reactions