Results |
 
|
Results |
|
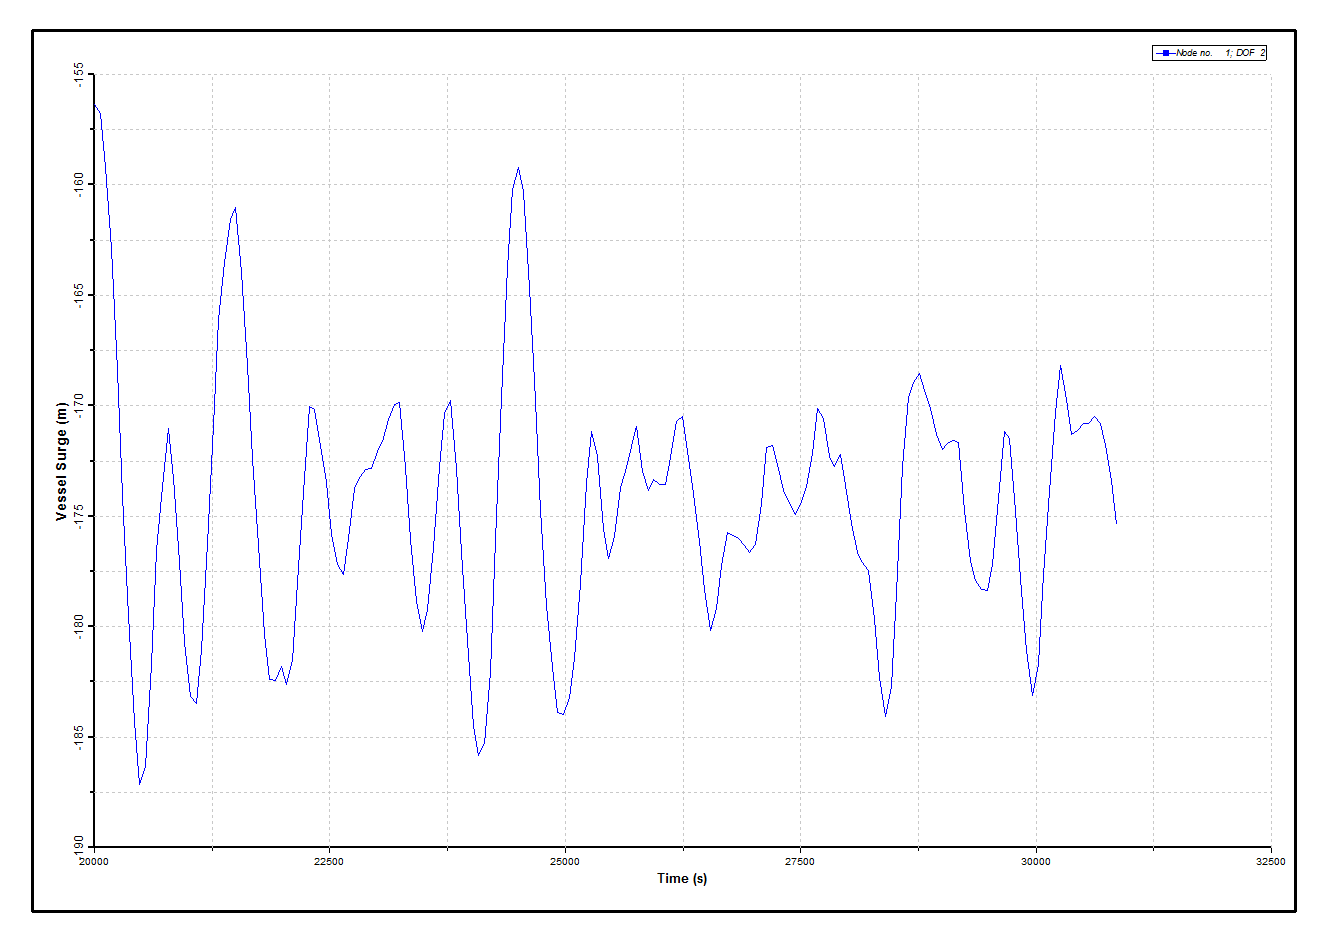
Results from the Phase 1 analyses are presented in the figures below. The Mean Vessel Surge figure shows the mean vessel surge due to wind and current (because of the direction of the environment relative to the vessel, sway and yaw are effectively zero). The final value is (-)6.35m. The Vessel Dynamic Surge figure plots the dynamic vessel response in surge. The Vessel Dynamic Surge figure shows an envelope plot of effective tension in each of the mooring lines, identifying that the maximum tension is experienced by Mooring Line 1. The Tension at Fairlead, Mooring Line 1 figure below shows a timetrace plot of effective tension at the fairlead of this line.
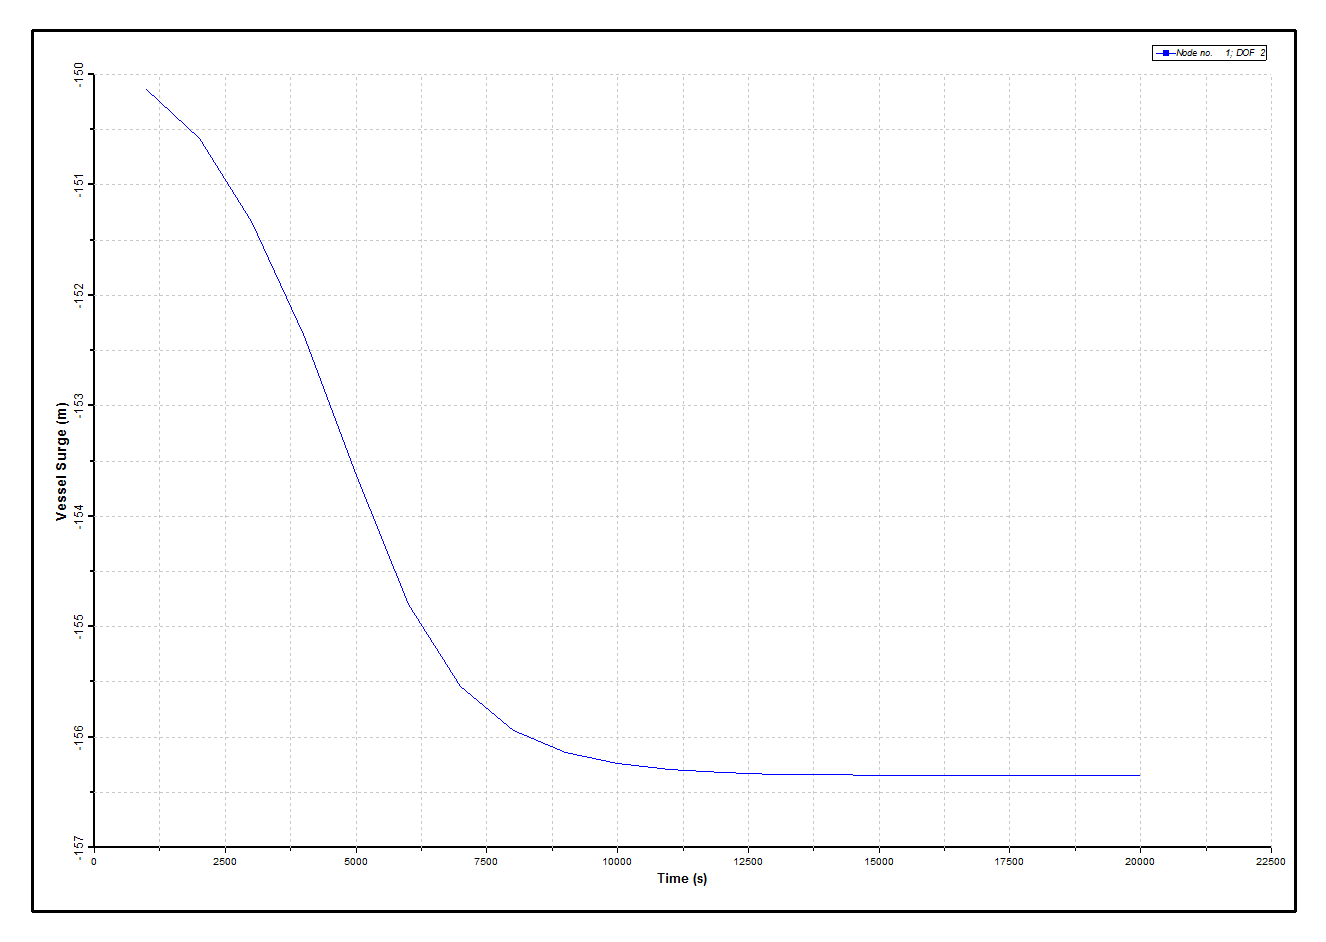
Mean Vessel Surge
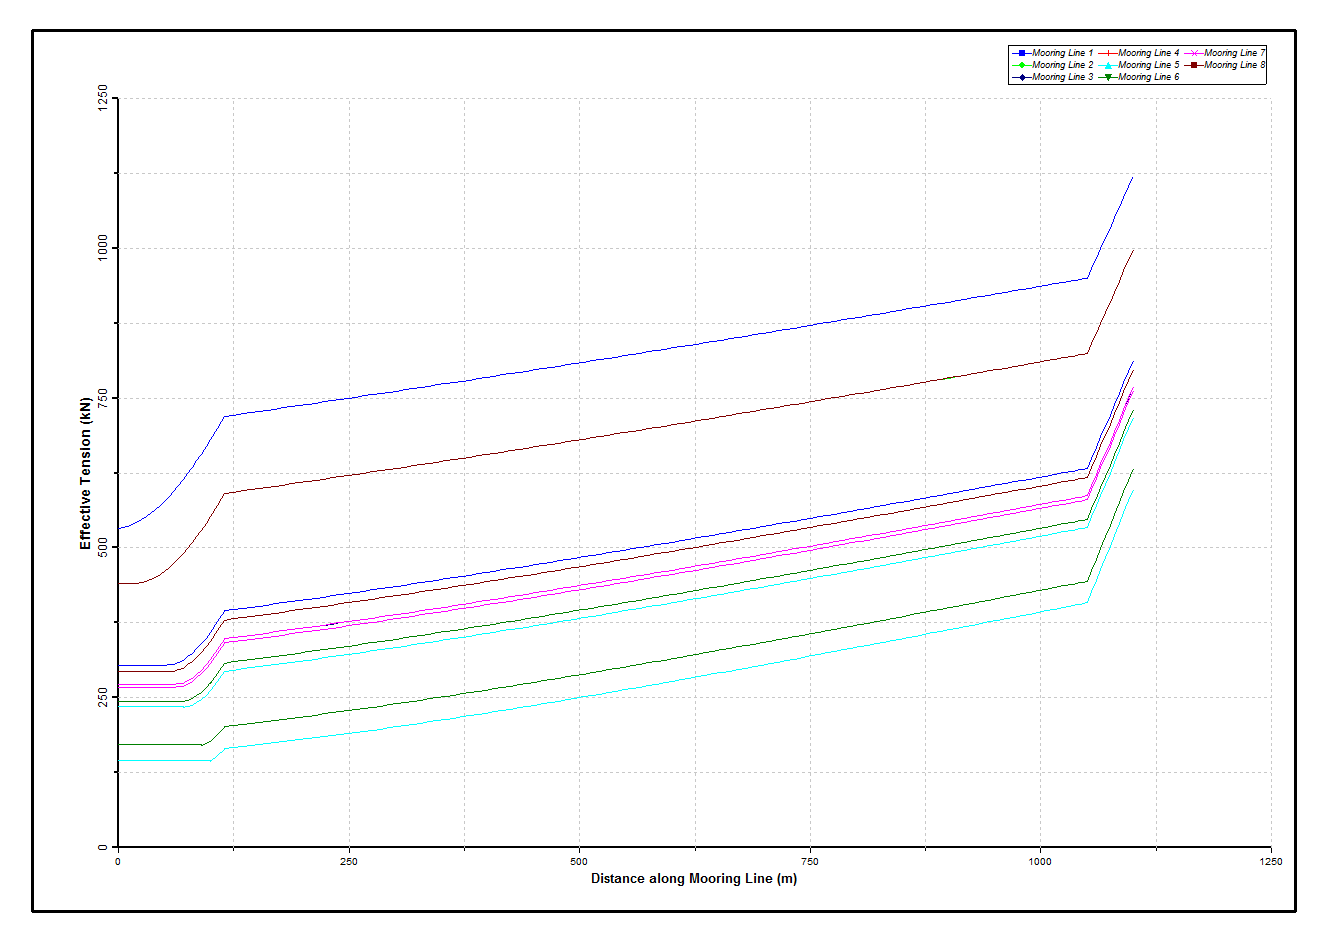
Mooring Line Tension Envelopes
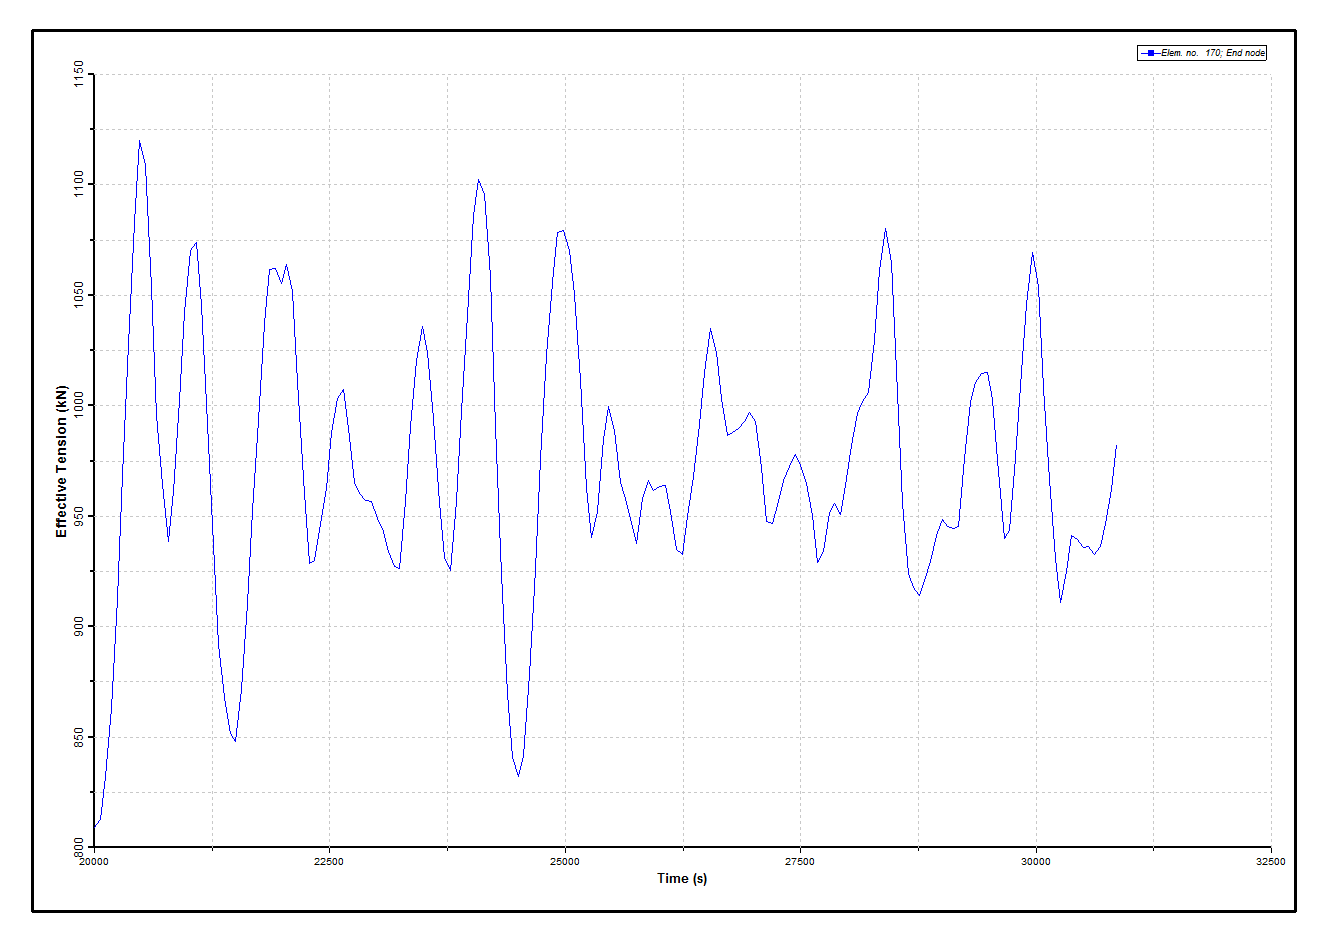
Tension at Fairlead, Mooring Line 1
The Dynamic Fairlead Motion figure below shows a timetrace plot of the motion of the mooring line fairlead in the vessel surge direction. This is clearly the Vessel Dynamic Surge figure above with the first order vessel motions superposed. Likewise the 'Dynamic Fairlead Tension' figure below shows a timetrace plot of fairlead tension, with the second order tension superposed for ease of comparison. Finally the Mooring Line Tension Envelopes figure shows envelopes of tension over the full mooring line, with again the curves from the Phase 1 and 2 analyses superposed. The maximum tension shows an almost 22% increase, from 1120kN to 1365kN. Although this is clearly not a design case, the results indicate the importance of having a facility to predict the second order vessel motions, and also a facility to combine first and second order motions in a dynamic mooring line analysis. Both capabilities are provided by Flexcom and make it a robust tool for mooring system design.
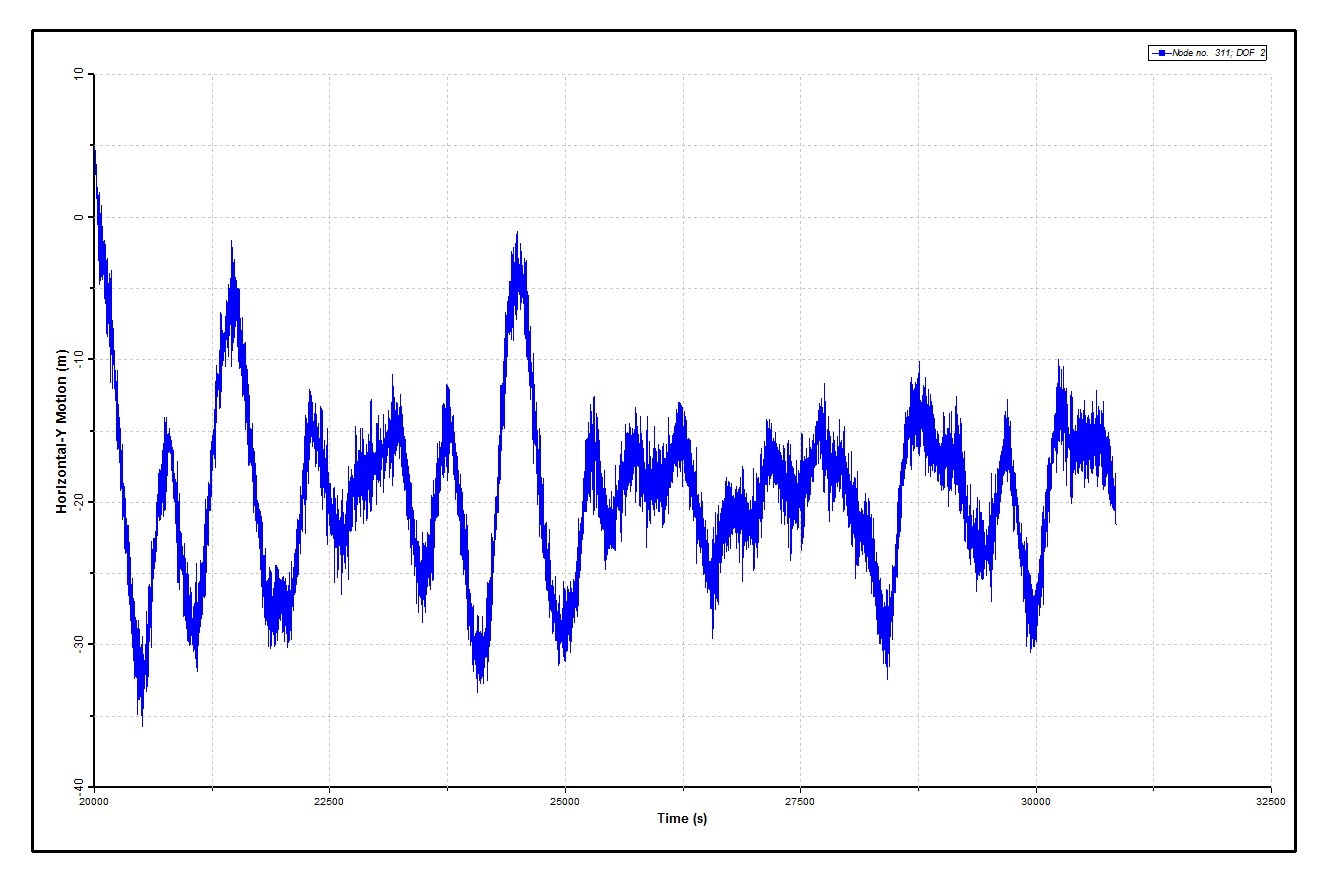
Dynamic Fairlead Motion
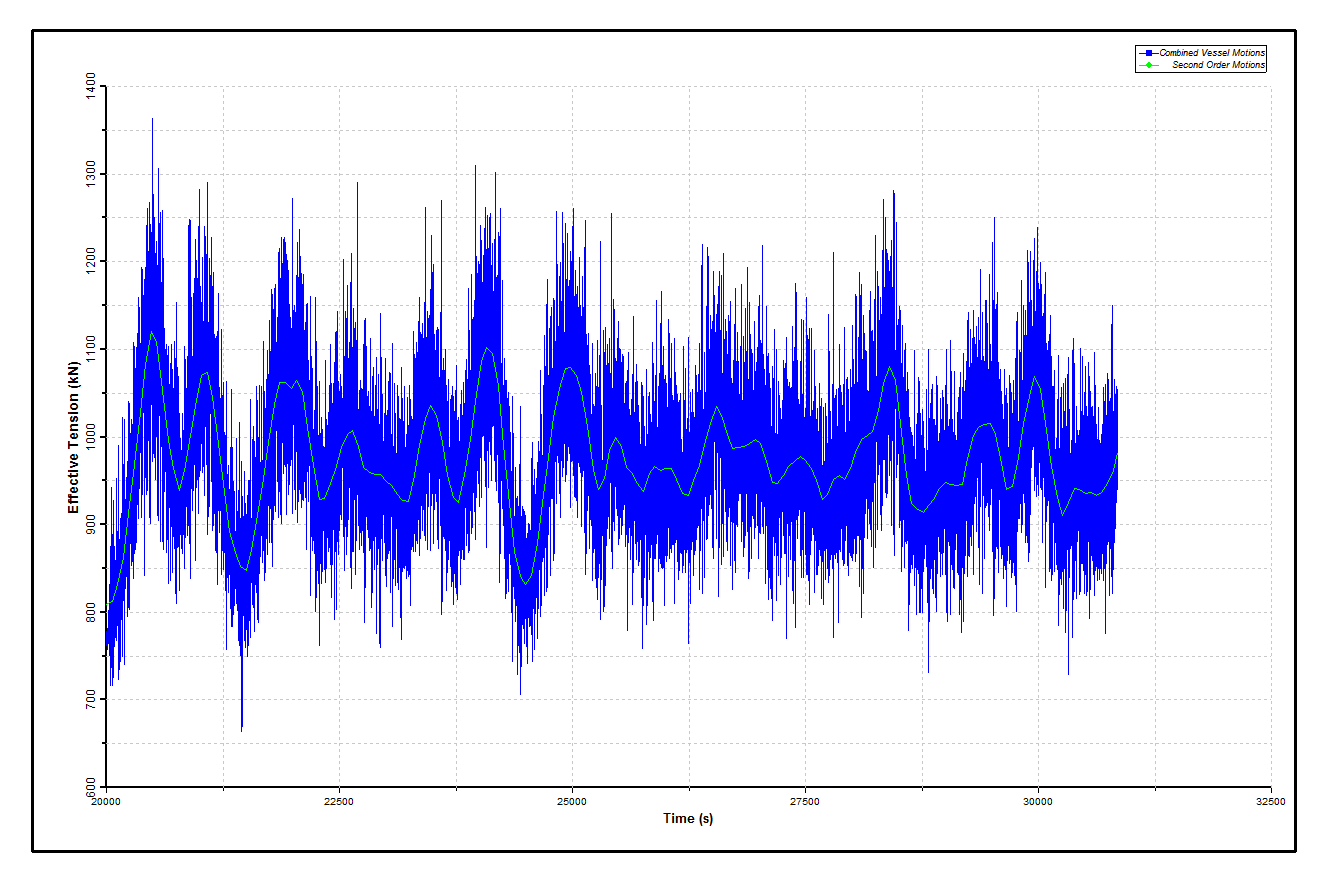
Dynamic Fairlead Tension
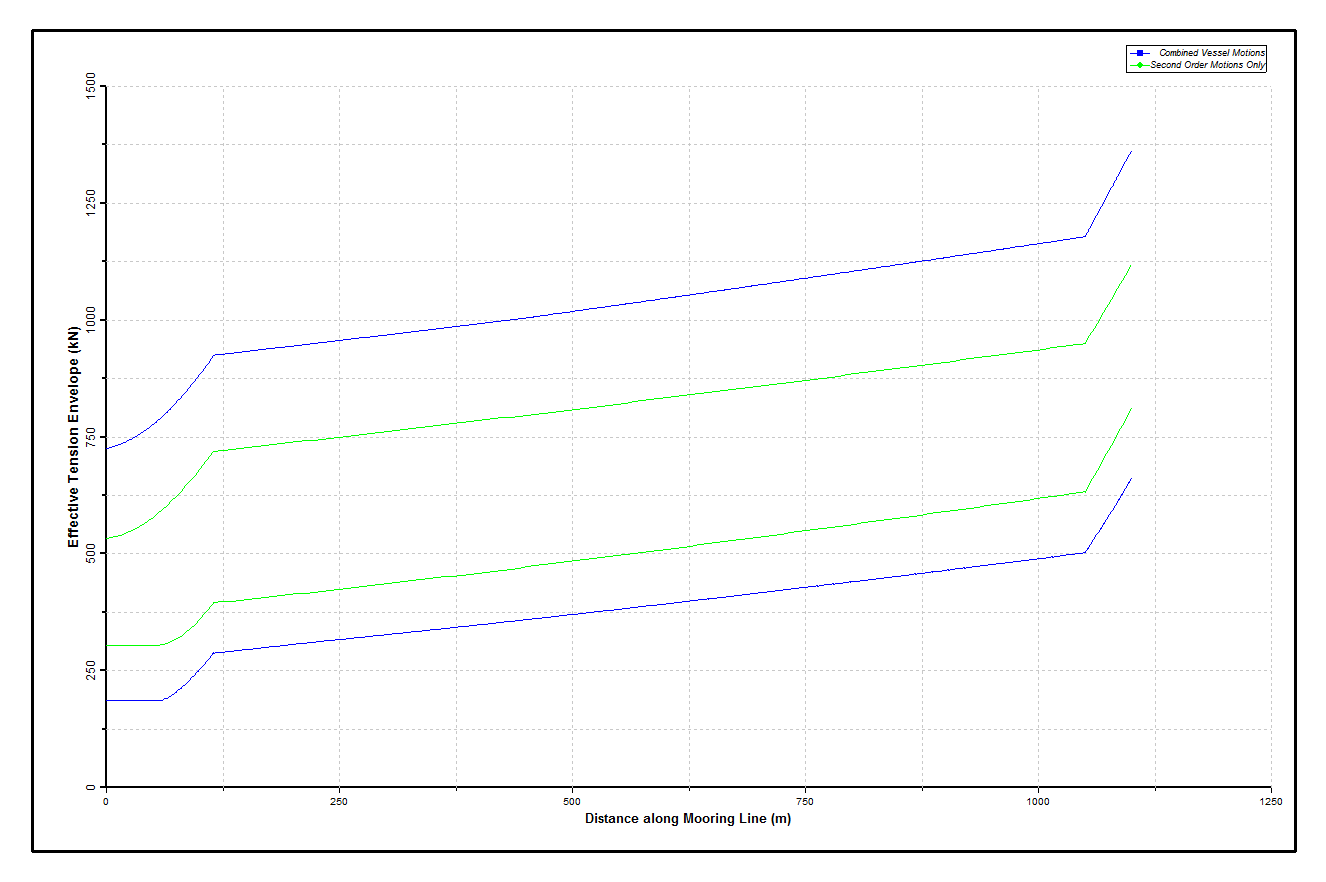
Mooring Line Tension Envelopes