Output Files |
 
|
Output Files |
|
When postprocessing timetrace data, a combination of plot files and a statistical summary file is produced. By default no plot files are produced. When the data comes from a regular wave analysis, you have the option of requesting a timetrace plot file for each variable in the data file. In the case of random sea data, you have the option of requesting (i) a timetrace plot, (ii) a plot of the spectrum of the output variable, or (iii) both plots.
Statistical output is always generated whenever the timetrace postprocessor is run. An example statistics extract is shown in the table below.
Sample Timetrace Output
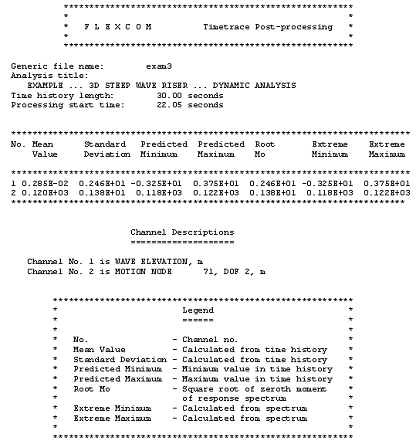
As you can see, the file contains a table of statistics, a description of each channel and a legend section. There is one line in the statistics table for each of the variables output to the timetrace file. The statistical parameters in the table are as follows:
•Mean value
•Standard deviation
•Predicted minimum value
•Predicted maximum value
•Square root of the zeroth moment of the spectrum of the variable
•The extreme minimum value
•The extreme maximum value
The first four parameters in the statistical table are calculated directly from the timetrace data using standard statistical procedures. The next parameter requires that the response timetrace is transformed into a response spectrum. The extreme values may be calculated using either the Rayleigh or Weibull distributions, as described in detail in Extreme Values.
If the timetrace data is created by a regular wave analysis then no response spectra are calculated and outputs (v), (vi) and (vii) default to outputs (ii), (iii) and (iv) respectively.
When the timetrace data is the result of a random sea analysis it is useful to compare outputs (ii) and (v). If they are not approximately equal then it is possible that the time history is not long enough for unambiguous statistics calculations, and that a longer simulation time may be required.
The data in the table above is an example from postprocessing results from a regular wave dynamic analysis. The outputs shown in the table above are augmented in the case of a random sea analysis by a table showing the zeroth to fourth moments of the response spectrum for each variable in the data.
•*PLOT is used to request the creation of plots using the timetrace postprocessing.
•*PARAMETERS is used to define miscellaneous parameters for use in timetrace postprocessing.