Spreadsheet Output |
 
|
Spreadsheet Output |
|
Spreadsheet based output, in the form of an Excel file, basically contains the same data as the Tabular Output, but it is conveniently formatted in a spreadsheet. For every postprocessing request, relevant output data is presented in an individual worksheet of the Excel file.
The figure below shows a sample spreadsheet output corresponding to a timetrace plot. When you request a timetrace of a variable, the output file contains a statistical summary including maximum, minimum, mean and standard deviation values.
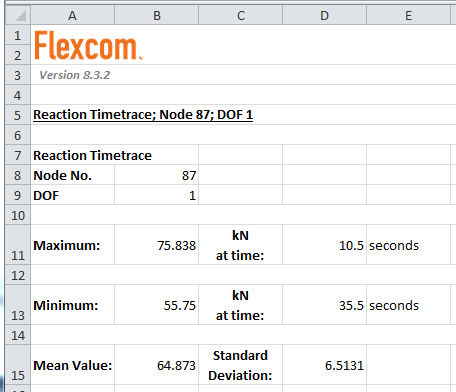
Sample Spreadsheet Output
The Plotting feature has a facility to export data from individual plots to Excel or CSV (comma seperated value) files. This is very useful if you wish to process the plot data further or present it differently. When working with a large number of plot files, perhaps through a script, this export procedure can get tedious. A more efficient approach is to request an additional CSV file to accompany all plot files (via the *OUTPUT FILES keyword). It should then be straightforward to extract the data from these CSV files into another application or through a script of your own.