Environment |
 
|
Environment |
|
The wave energy converter was developed and tested offshore Western Australia. At the time of writing, a wave scatter diagram for this location had not been obtained, so a generic scatter diagram was assumed for illustrative purposes.
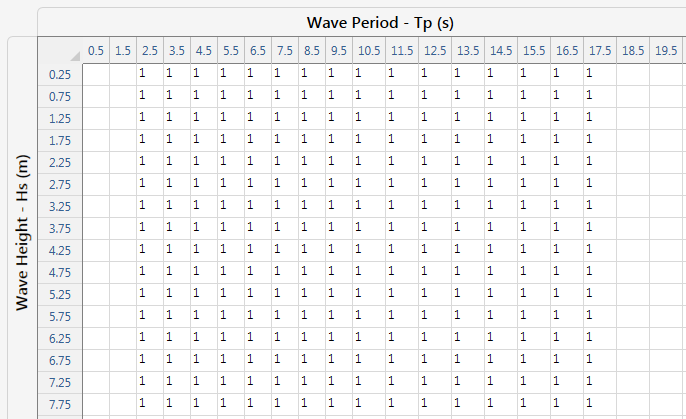
Note that as the latest version of Flexcom predicts an electrical power matrix (e.g. kW), rather than estimating total annual energy production (e.g. MWh), the number of occurrence entries in the scatter diagram are actually immaterial as they are not used by the software.
Numerical simulation of an entire scatter diagram in the time domain can be quite computationally expensive, so the Summary Wave Scatter feature offers an economical extrapolation technique with a view to estimating the full results matrix based on a selection of ‘reference seastates’ within the scatter diagram. The scatter diagram is first sub-divided into ‘blocks’, where similar seastates are grouped together, before a single seastate is nominated as being representative for each block. Based on the numerical simulation results for the reference seastate within each block, the program fabricates a Summary Database File for each of the remaining cells within the block. This allows Summary Postprocessing Collation to be used as normal to collate results from all seastates.

Nomination of Seastate Blocks and Reference Seastates
The wave scatter diagram contains a total of 256 different seastates with non-zero percentage occurrences, spanning across 16 different periods and 16 different wave heights. For computational efficiency, the scatter diagram is sub-divided into 16 blocks as shown above, with one block for each different wave period, and a sample wave height selected as the reference seastate within each block.
Numerical Parameters are defined to represent significant wave height (Hs) and wave peak period (Tp), and Keyword Based Variations are used to define values of Hs and Tp appropriate to each individual simulation. The *COMBINATIONS keyword is used to generate the required input files based on the master template file, and neatly names each file based on the Hs and Tp values.
After the dynamic simulations for the 16 reference seastates have been completed, the Summary Wave Scatter feature is used to fabricate Summary Database Files for all the non-reference seastates in the wave scatter diagram. The Summary Postprocessing Collation feature is then used to create 3D plots of electrical power and tether fairlead tensions.