Results |
 
|
Results |
|
With the internal fluid present, the pipeline is fully weighted, and vertical reaction forces are exerted by the seabed.
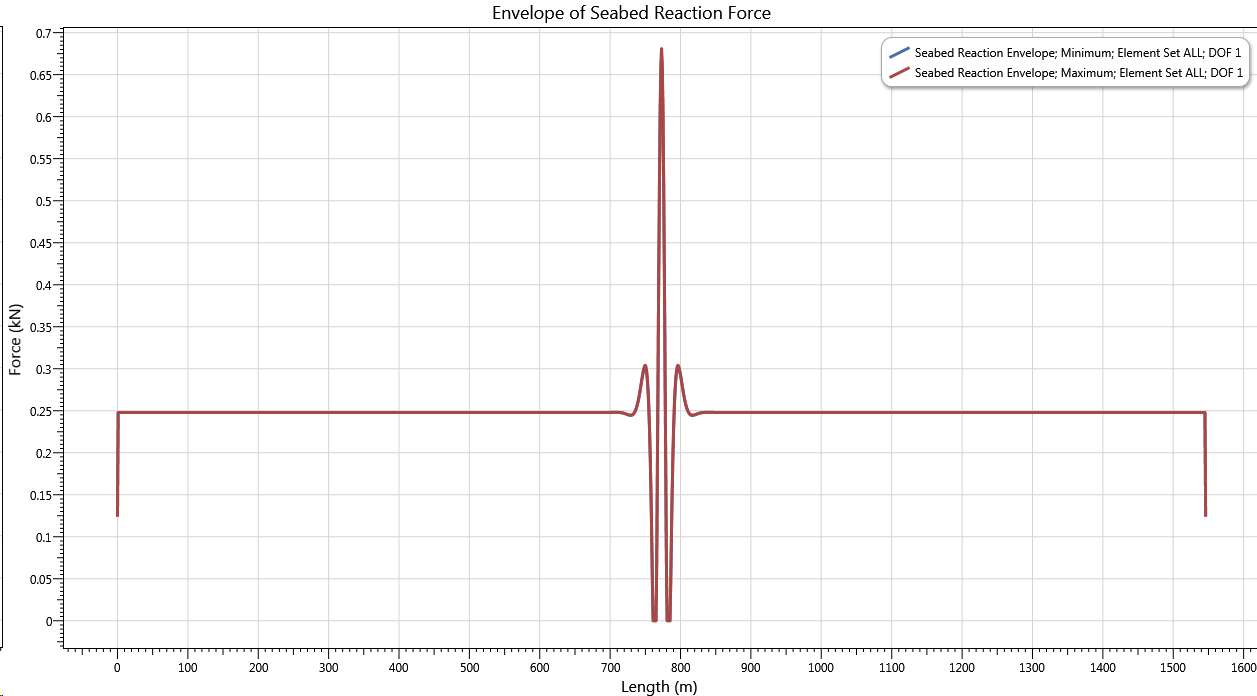
Seabed Reaction Force
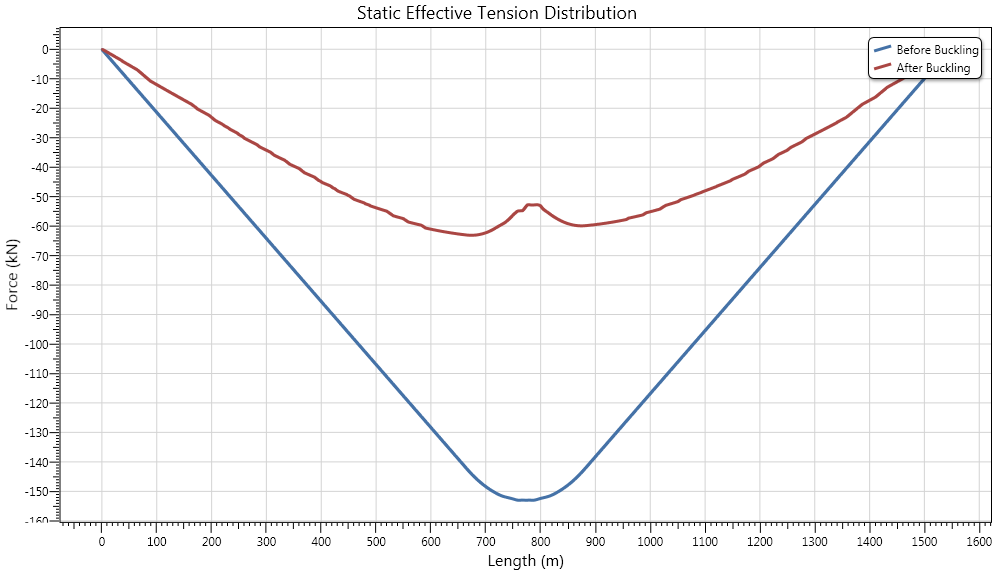
Results from the static analysis in which the temperature loading is introduced are presented in the figure below, which shows a plot of the effective tension distribution in the pipeline. There is clearly a significant compressive axial load as required due to the temperature loading and the seabed friction.

Static Effective Tension Distribution
Results from the dynamic analysis are presented in the figures below. The figure below shows a timetrace plot of vertical motion at the mid-point of the pipeline. It is clear that the pipeline lifts a considerable distance off the seabed as the slug passes, indicating that the pipeline is indeed susceptible to upheaval buckling.
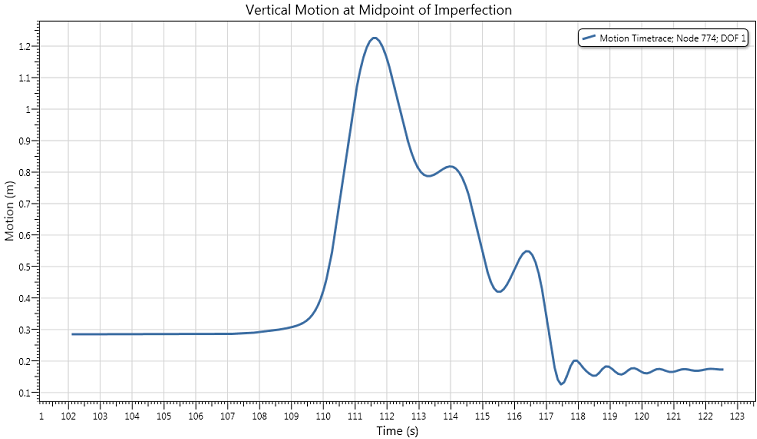
Vertical Motion at Midpoint of Imperfection
The first figure below shows a timetrace plot of effective tension at the mid-point of the pipeline. Consistent with the figure above, the plot indicates a substantial release of compression due to buckling. The second figure below shows a snapshot of effective tension at the end of the analysis, comparing it with the tension distribution before the dynamic analysis. Again a substantial release of compression is indicated, demonstrating that Flexcom has predicted upheaval buckling for this pipeline configuration and loading.

Effective Tension at Midpoint of Imperfection
Pipeline Compression following Onset of Buckling