Results |
 
|
Results |
|
The following figures contain a selection of results. The first figure below shows the static effective tension in one of the mooring lines. Effective tension in one of the production lines is shown in the second figure.
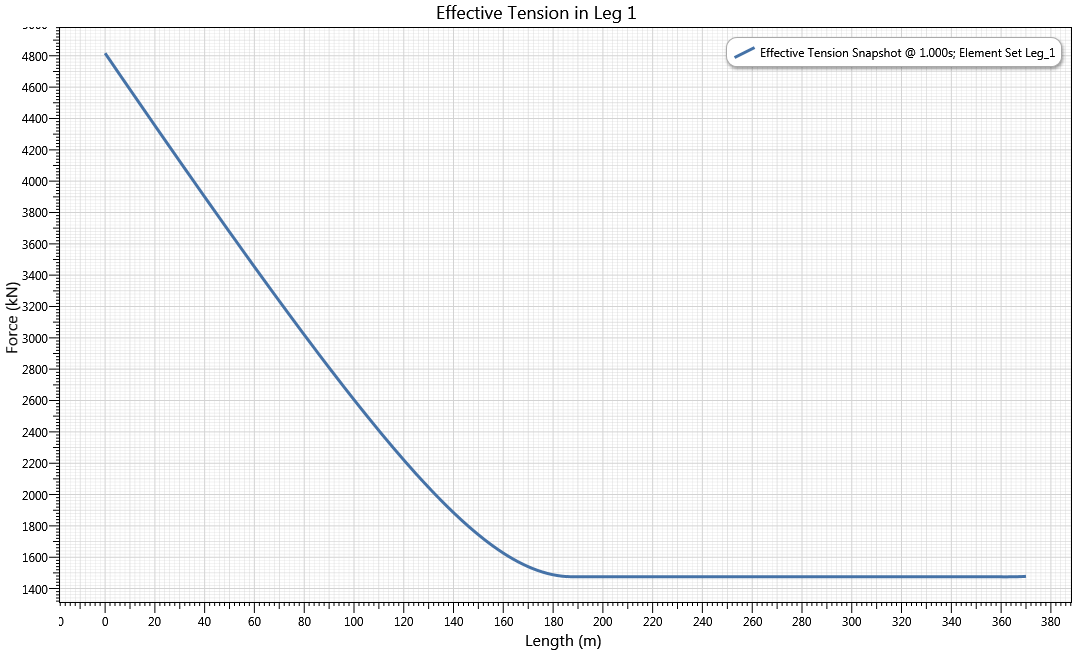
Static Mooring Line Tension
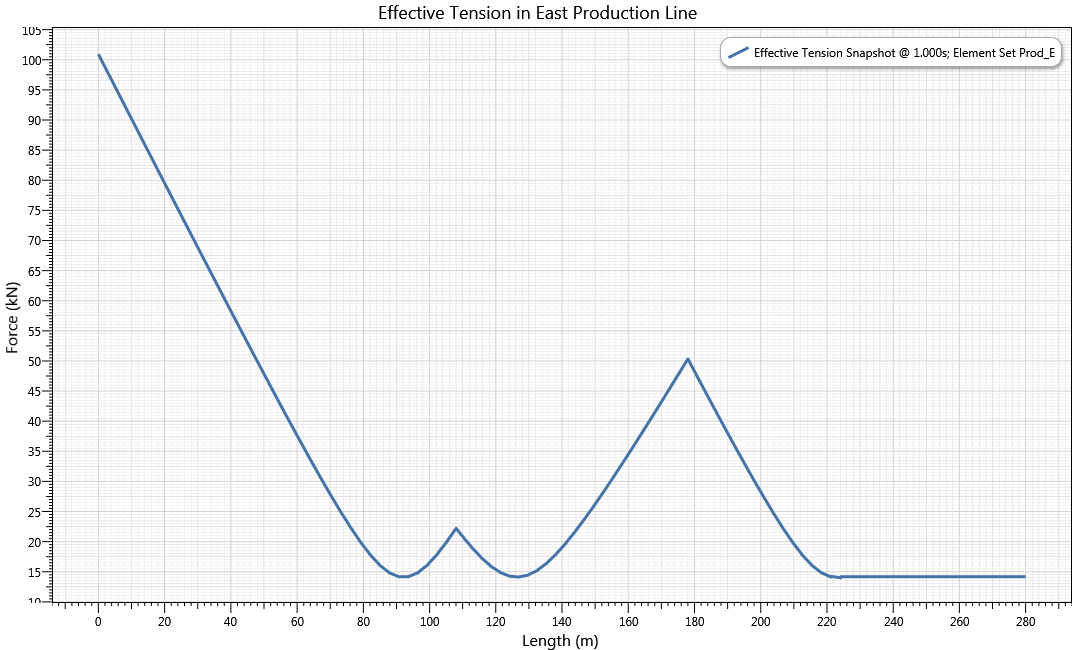
Static Production Line Tension
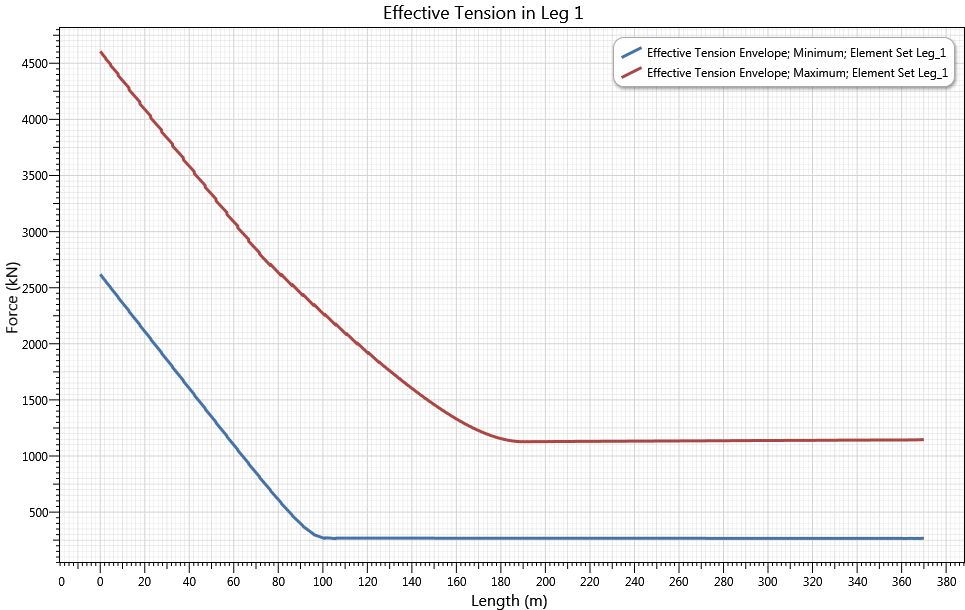
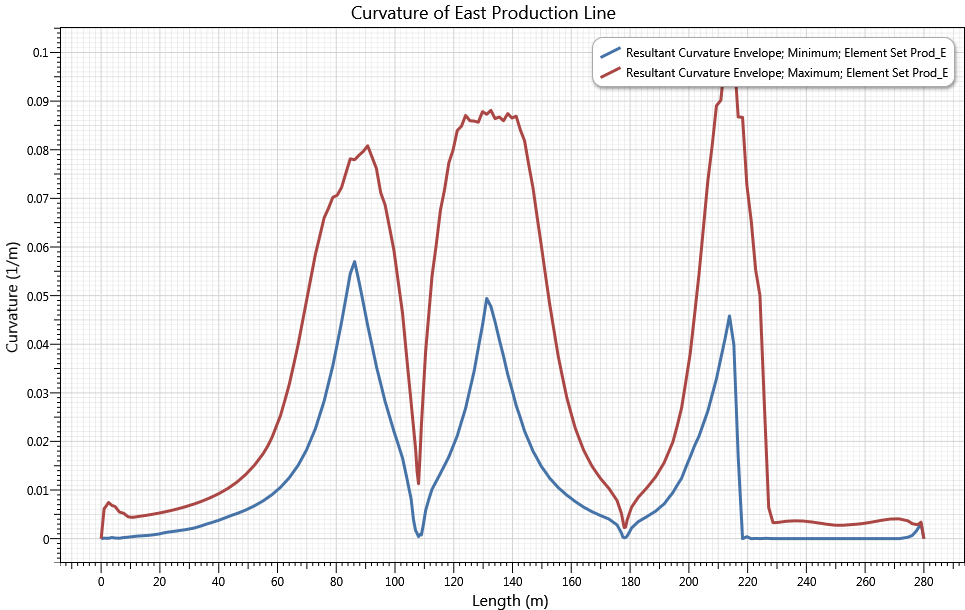
The first figure below shows the mooring line tension envelope for line 1 the connected buoy. The second figure shows an envelope of curvature for the east production line.
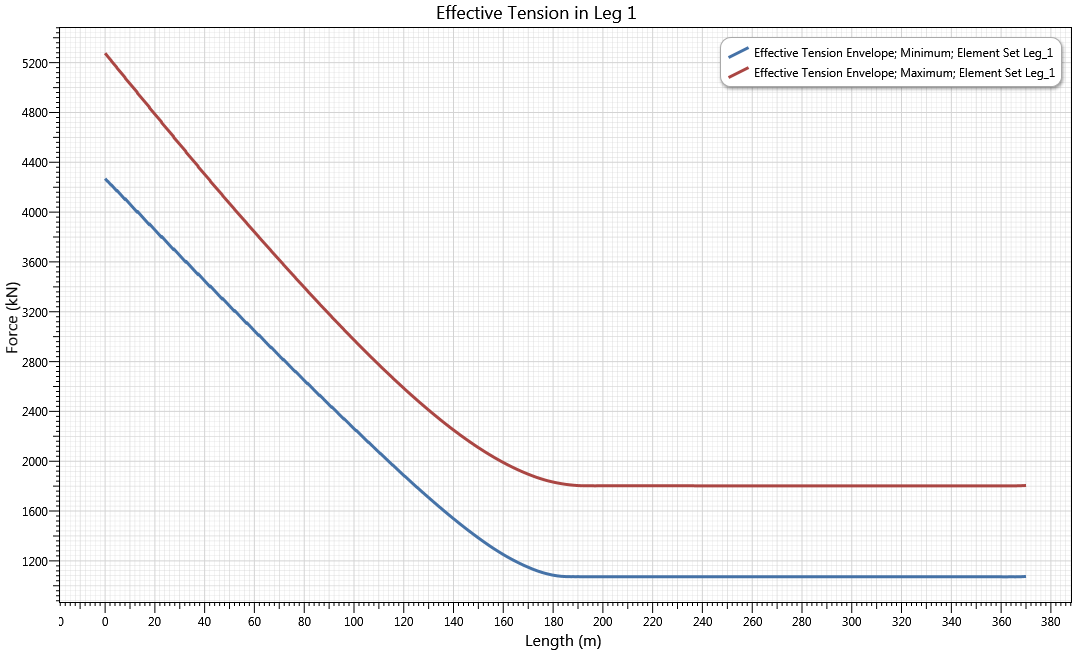
Mooring Line Tension Envelope (Connected)
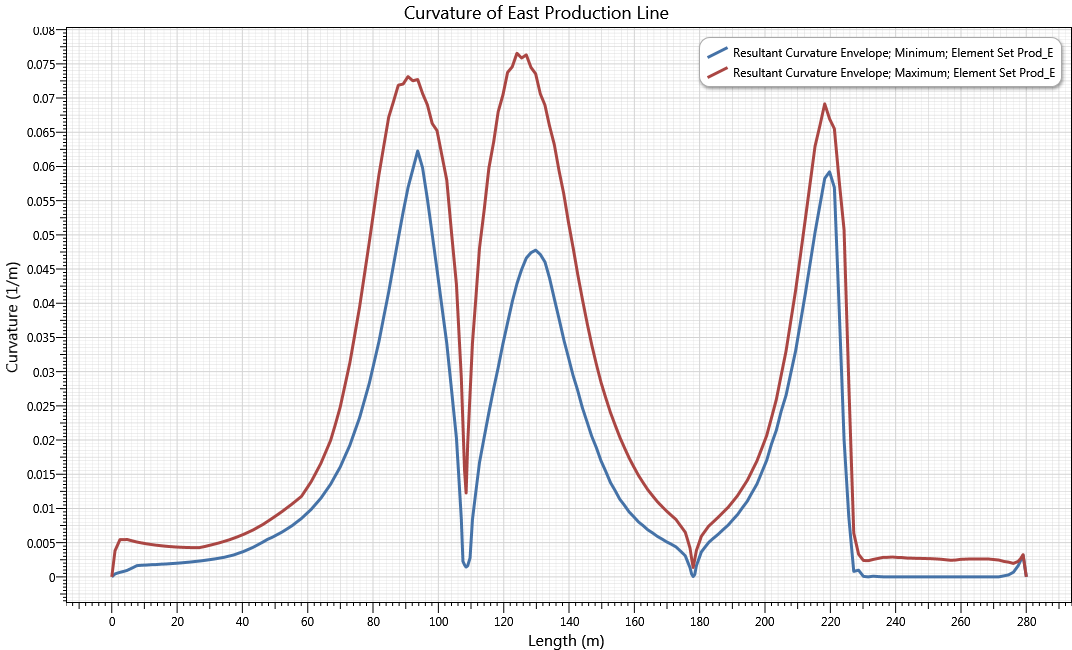
Production Line Curvature Envelope (Connected)
In this disconnect analysis, several parameters are monitored to ensure the adequacy of the model. The vertical motion of the buoy is one of the easiest parameters to check to ensure satisfactory behaviour. Additionally, any contact forces between the buoy and the moonpool are examined. These results are presented in the first and second figures below.
Once the engineer is satisfied these parameters are consistent with expectations, the system is then checked with respect to mooring line tensions and riser curvatures. Sample results are presented in the final two figures.
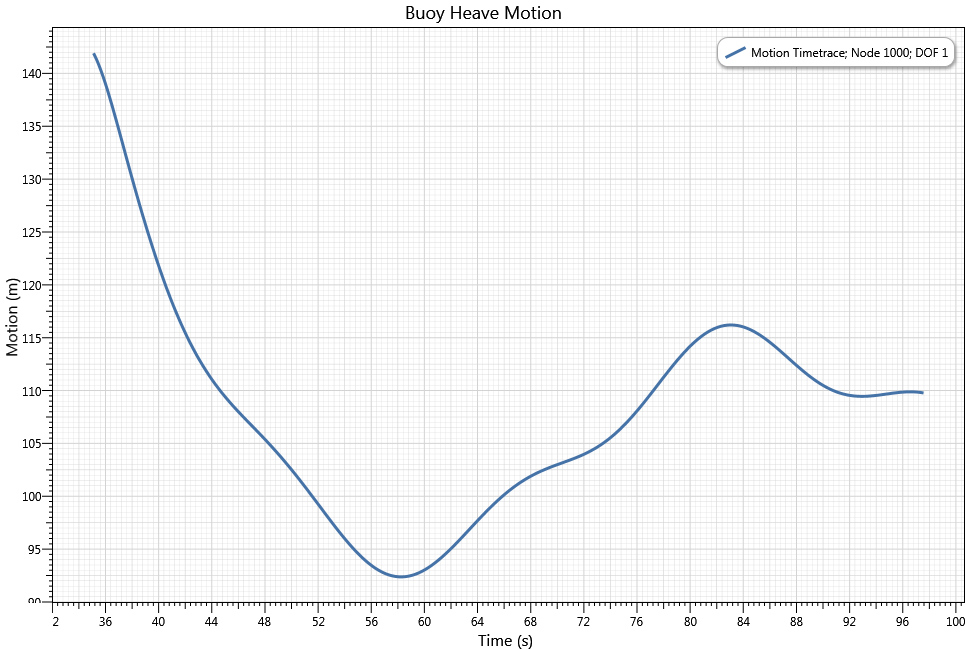
Vertical Motion of the Buoy
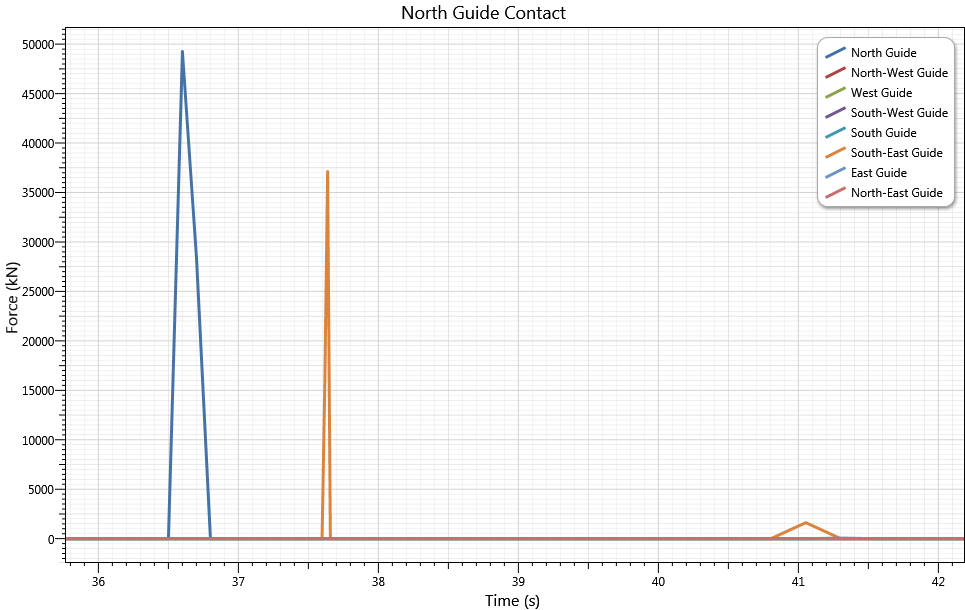
Moonpool Contact Forces
Mooring Line Tension Envelope (Disconnected)
Production Line Curvature Envelope (Disconnected)