Frequency Domain Cycle Counting Analysis |
 
|
Frequency Domain Cycle Counting Analysis |
|
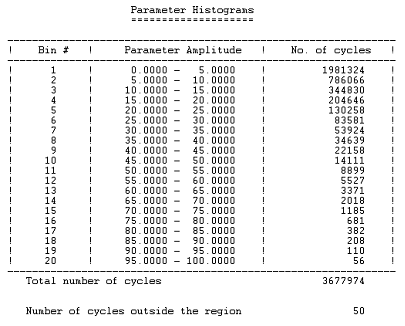
In this example, a response histogram of bending moment is requested for the location of minimum fatigue life as predicted in the preceding fatigue analysis. The results from the analysis are presented in tabular (Histogram in Tabular Format table below) and graphical (Histogram in Graphical Format figure below) format. It is clear from these outputs that the bins definition is reasonable for the histogram.
Histogram in Tabular Format
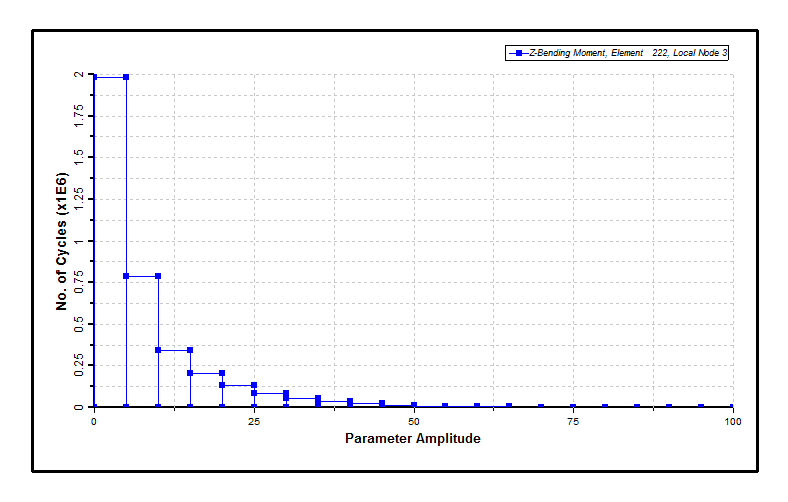
Histogram in Graphical Format