Results |
 
|
Results |
|
The first figure below presents the envelope plot of bending moment for the pipeline. A peak can be noticed on this plot, and this is further explored using a time history plot of bending moment, as shown in second figure below. Bending moment at this element reaches maximum value as pipeline bends over the precipice and the pipeline length increases, as illustrated in the third figure below.
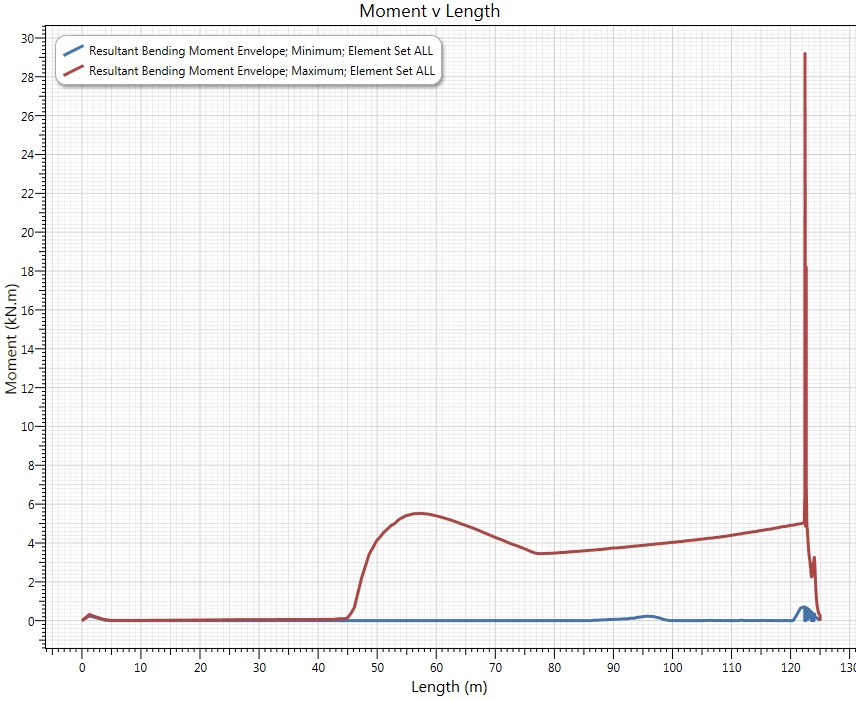
Bending Moment Envelope
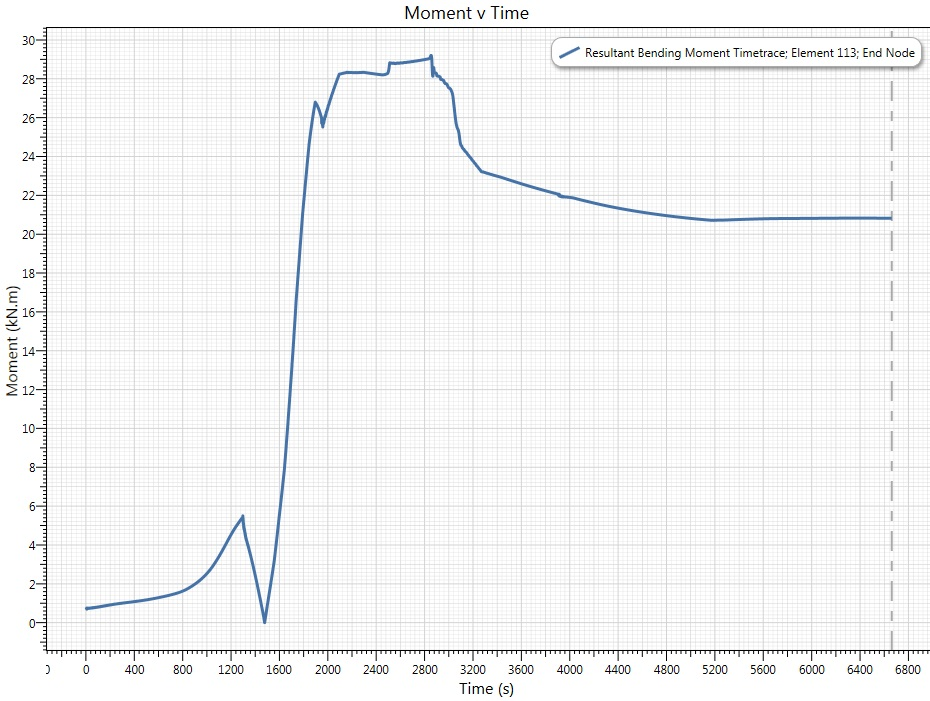
Time History of Bending Moment at Maximum Location
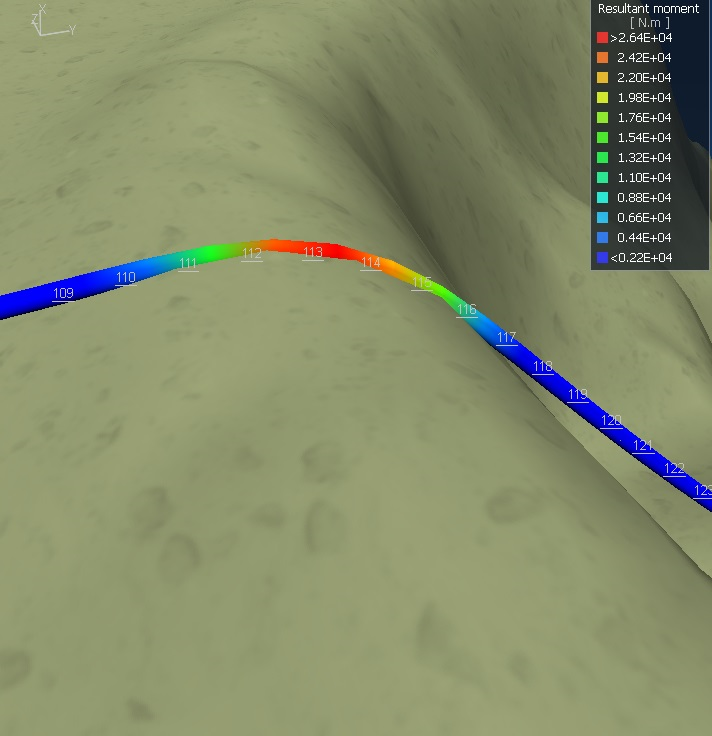
Maximum Bending Moment Location
The next figure shows a time history of seabed reaction force at the critical node, a measure of the maximum localised force being exerted on the pipe in this region. The time of peak reaction force corresponds with the peak in bending moment.
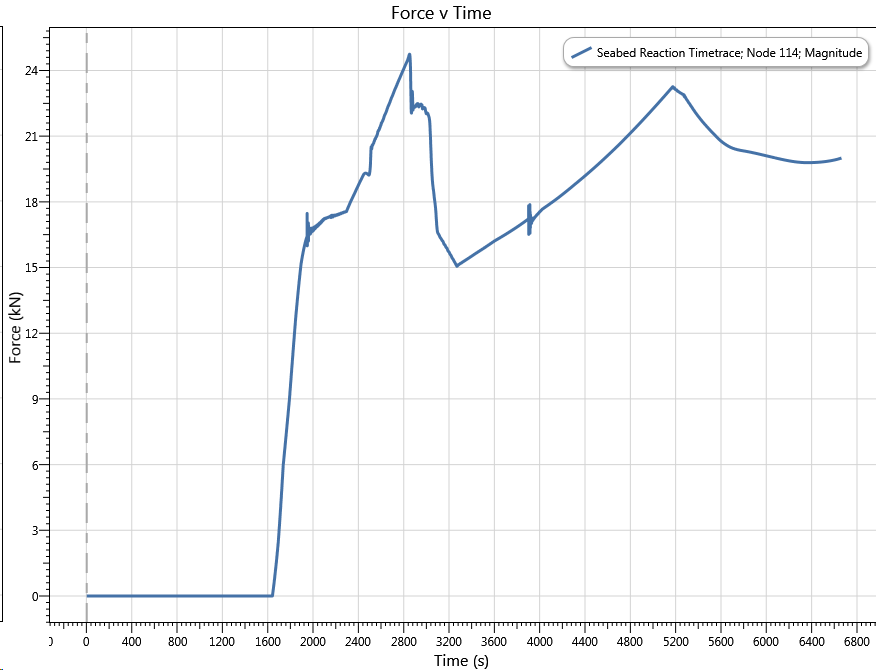
Time History of Seabed Reaction at Critical Location
The time history of effective tension at the vessel connection is shown in the figure below. Tension increases fairly linearly as the pipe is laid over the subsea precipice, due the increase in pipe suspended length. There are some local peaks in effective tension, correspond to the start and end times of the second winch. These could be smoothed had ramping been applied to the winch velocity.
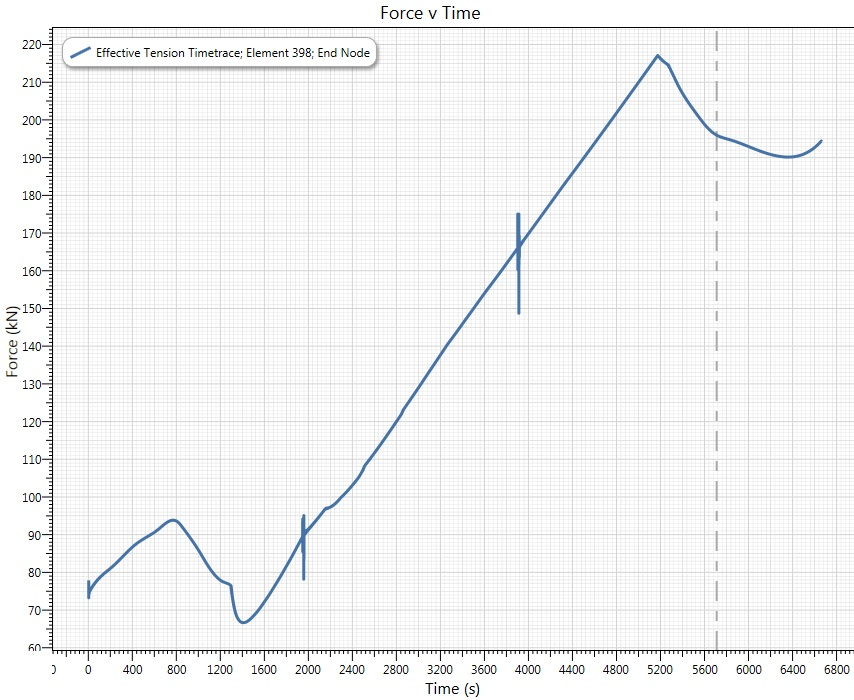
Time History of Effective Tension at Vessel End