Element Statistics Example |
 
|
Element Statistics Example |
|
This example shows how to generate a variety of statistical data in an Excel Worksheet (“VBA Database Access - Model Statistics.xlsm”) for a Flexcom database file using Excel VBA macros. The input is the path to the database file and is written in cell “C3” of the Excel Spreadsheet.
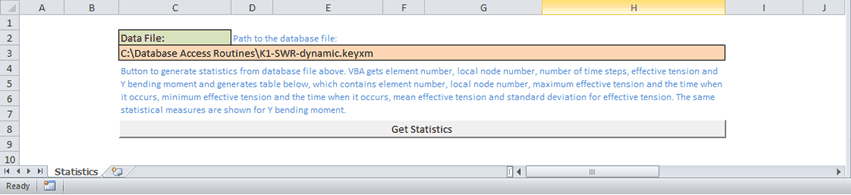
Get Statistics button in Excel file
There are three macros associated with this example:
•The first VBA macro, “Main”, clears the charts in the current workbook and the data in the active spreadsheet and then calls the other two macros. Permission will be requested to delete each chart; select “Yes” each time.
•The second VBA macro, “Retrieve_Data”, reads the element number, local node number, number of time steps, effective tension and y bending moment from the model database. A table of statistical measures is then created. It contains the element number, local node number, maximum effective tension and the time when it occurs, minimum effective tension and the time when it occurs, mean effective tension and the standard deviation. The same statistical measures are also calculated for local-y bending moment.
•A third VBA macro, “Create_Charts”, creates two plots; minimum and maximum effective tension versus element number, and minimum and maximum y bending moment versus element number, in two new sheets.
The code generates envelope plots of bending moment and effective tension in Excel.

Bending Moment Envelope

Effective Tension Envelope