Results |
 
|
Results |
|
The figure below shows the horizontal motion of the mid-point of the hose as it approaches static equilibrium, starting from the initial approximate semi-circular shape.
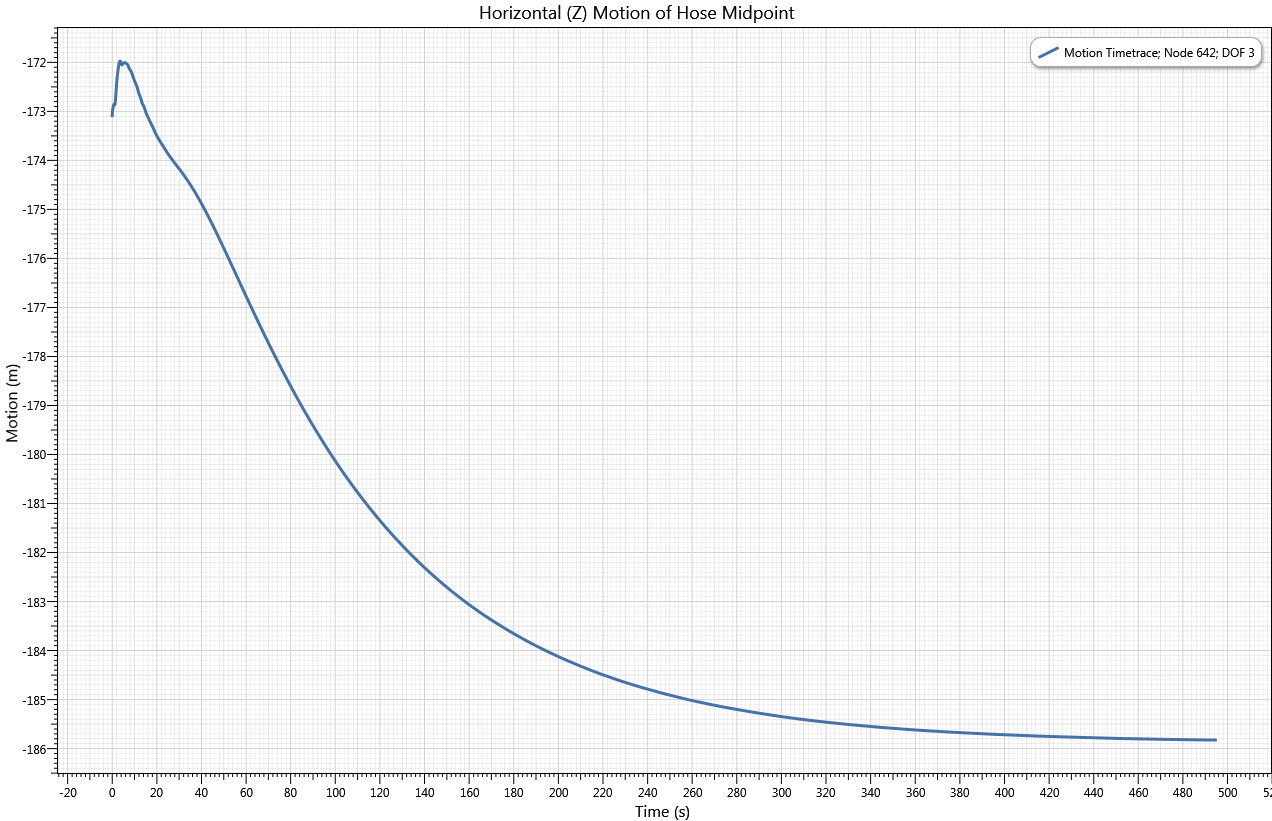
Horizontal (Z) Motion of Hose Midpoint
The following figures contain a selection of results from the dynamic analysis of a regular wave of period 9 seconds. The first and second figures below show the bending moment in the hose at the semi sub end and the FPSO end, respectively, while the third figure shows the moment envelope for the entire hose. The most severe moments occur at the vessel connection points as expected.
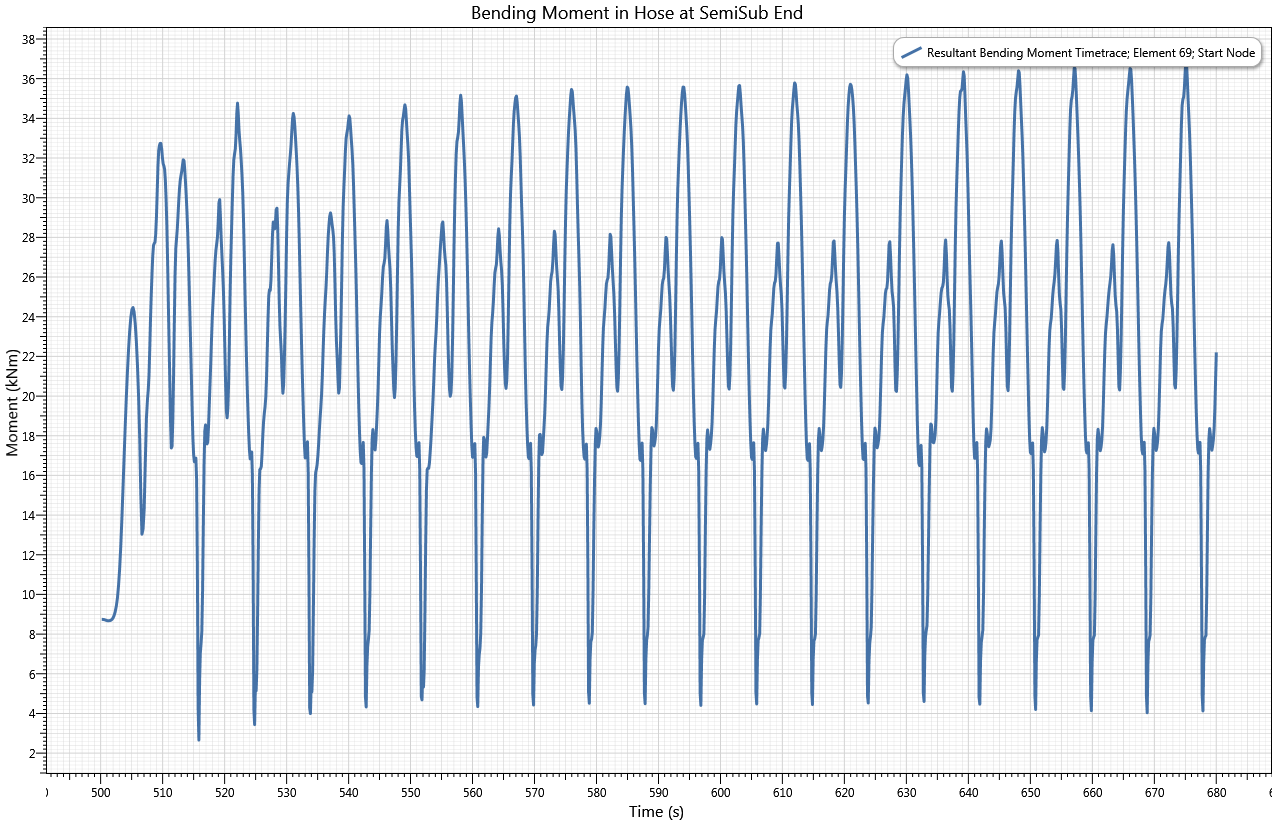
Bending Moment Semi-Sub End
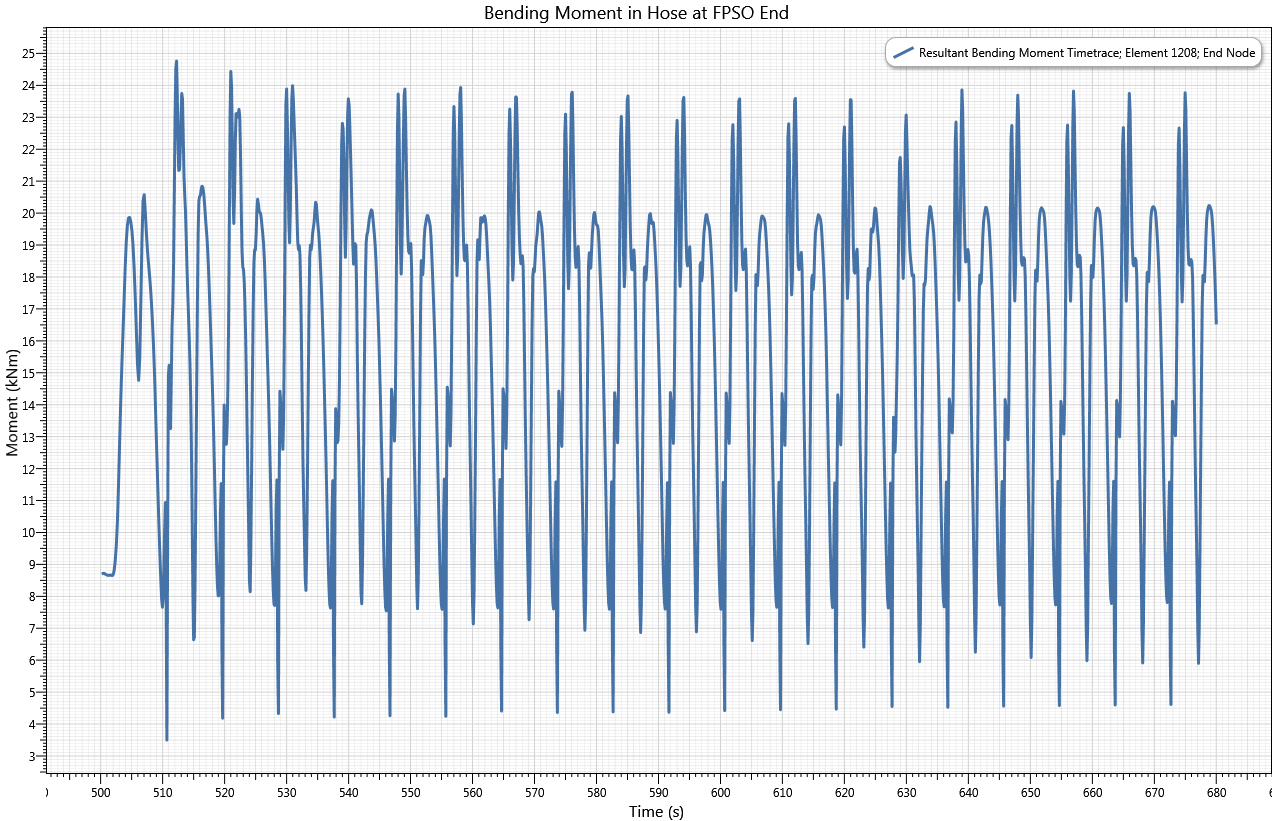
Bending Moment FPSO End
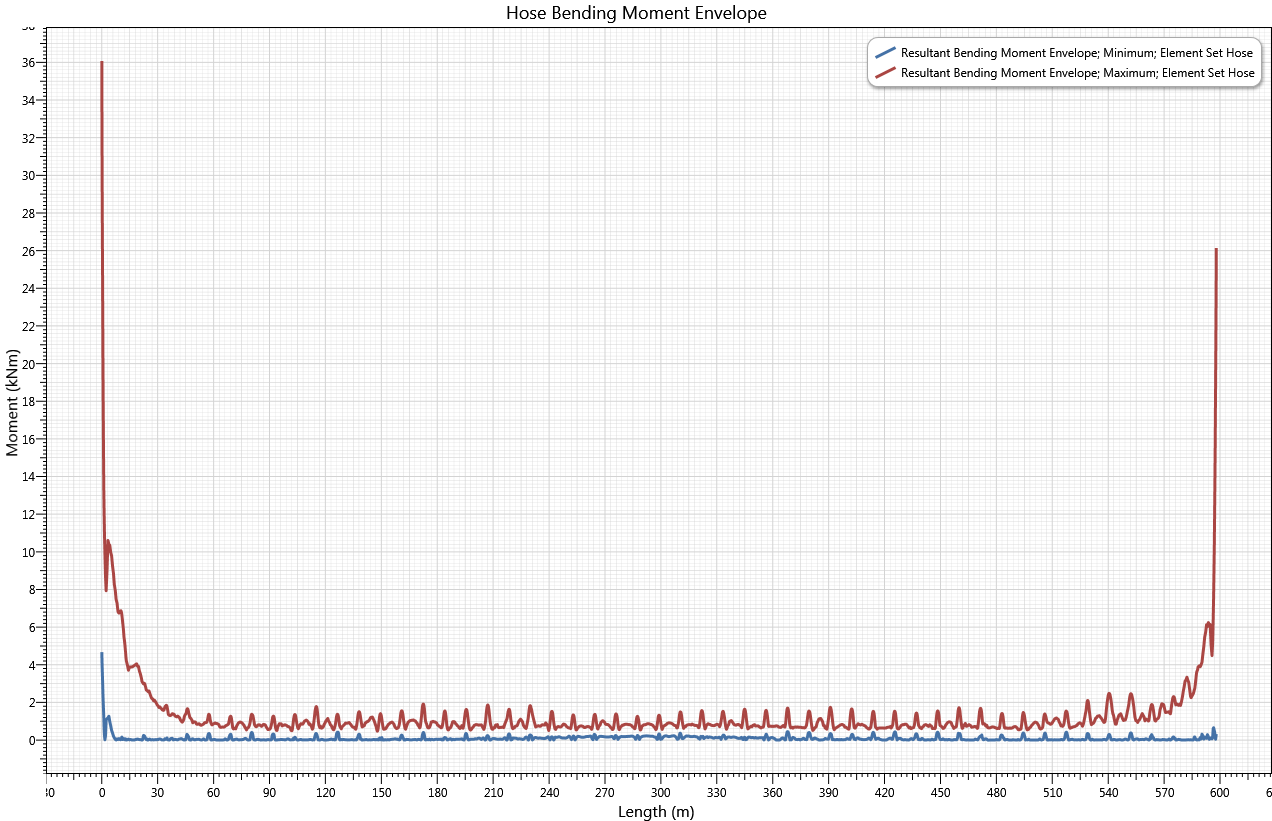
Bending Moment Envelope
The final figure below shows the summary collation spreadsheet. As highlighted in the extreme values section, the maximum bending moments occur for the 8s and 9s regular wave cases.
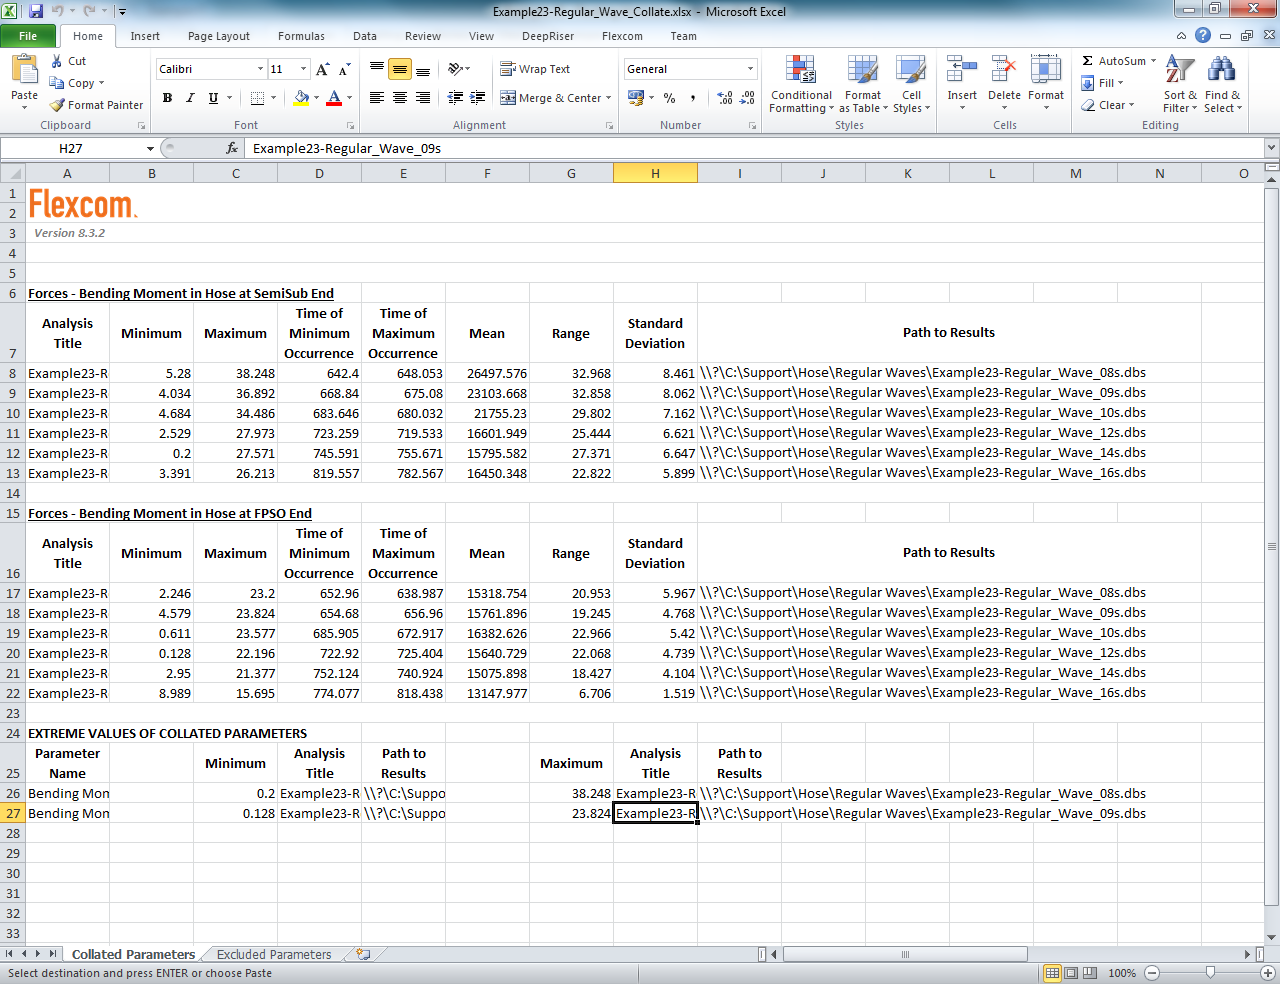
Summary Collation