Results |
 
|
Results |
|
Static Bending Moments
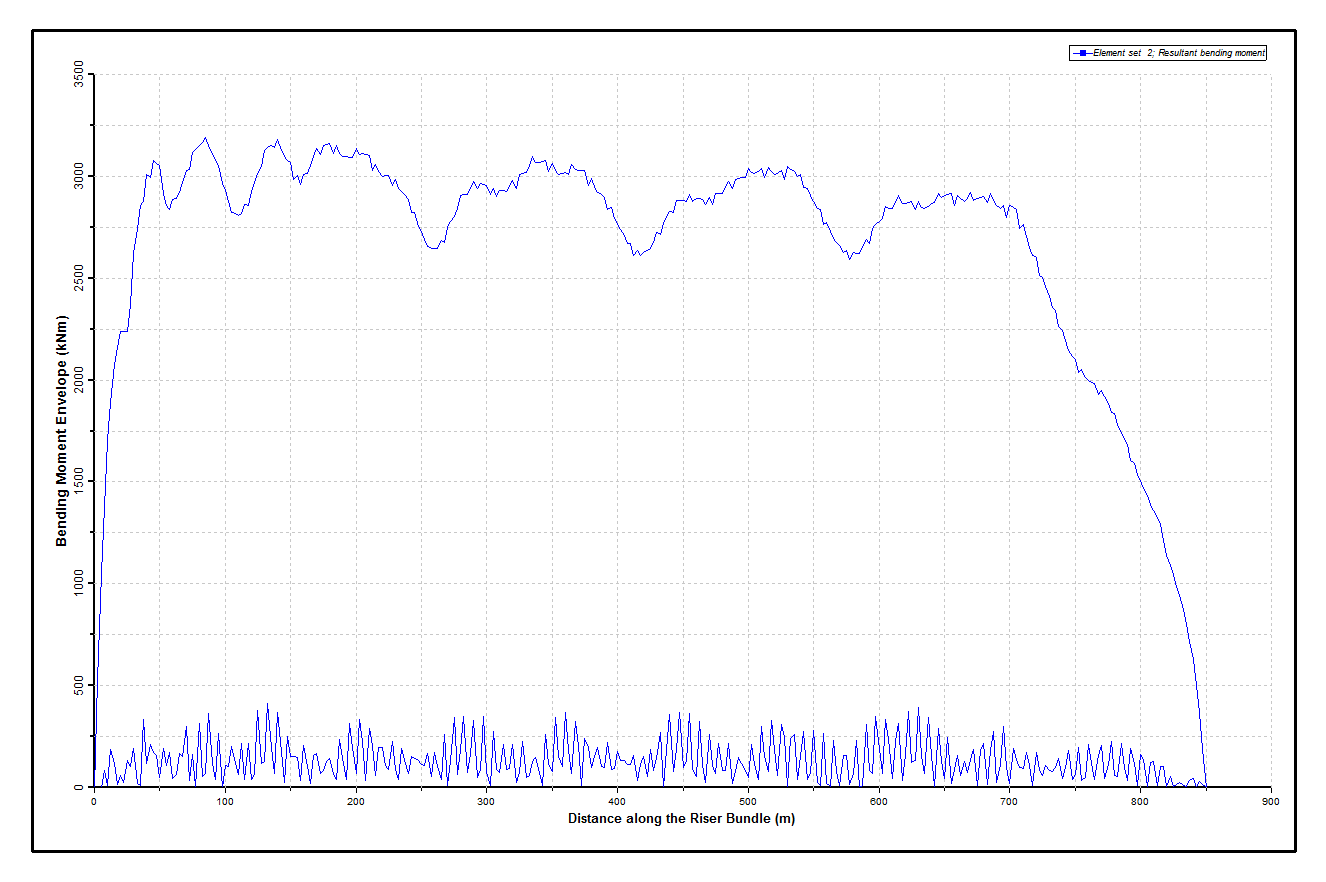
Results from the dynamic analysis are presented in the figures below. The first figure shows envelopes of bending moment from the last two wave periods. The maximum dynamic bending moment experienced by the riser bundle is over 3000kNm. The second figure shows envelopes of curvature, which naturally show a similar profile to the bending moments.
Dynamic Bending Moments
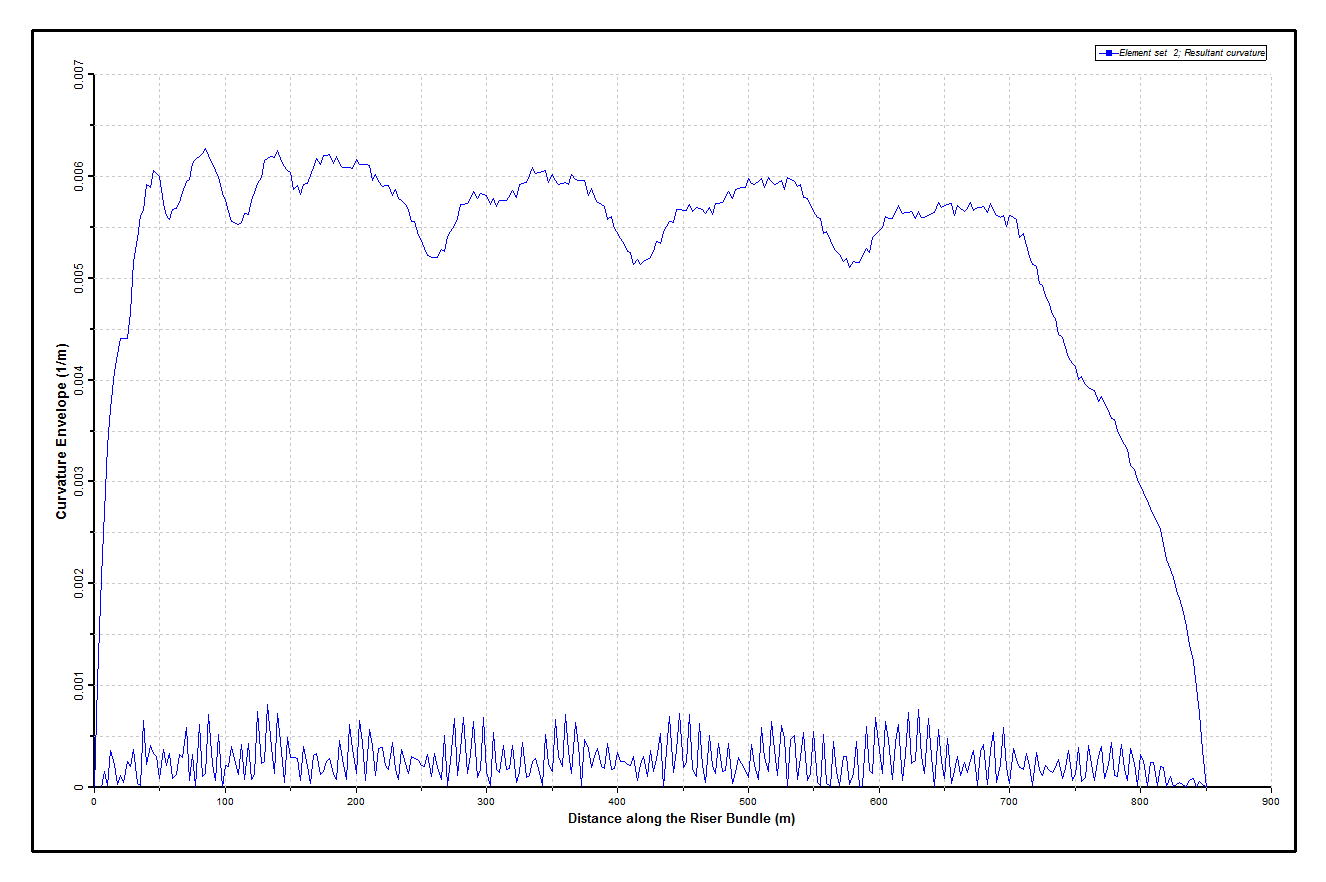
Peripheral Lines Dynamic Curvatures
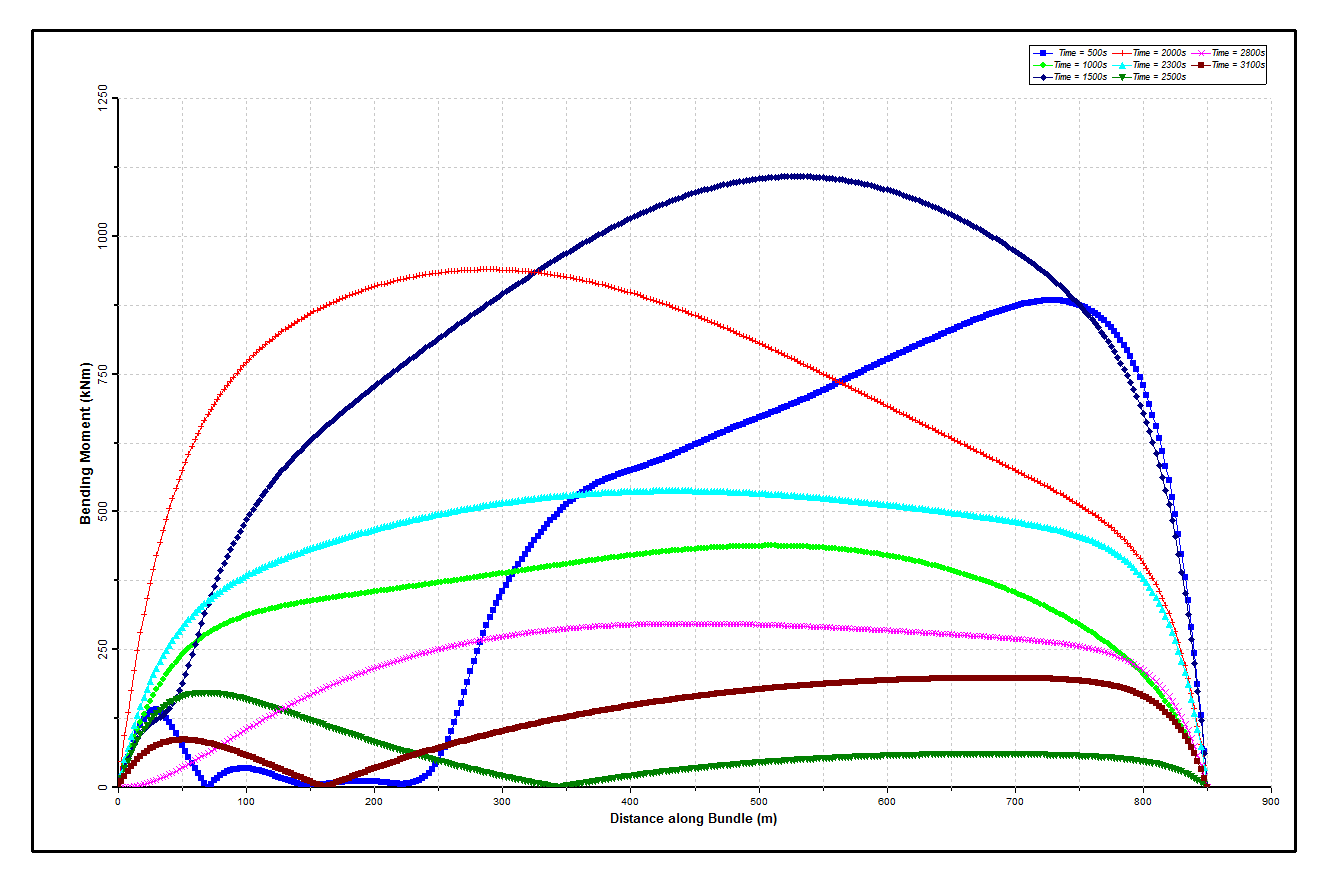
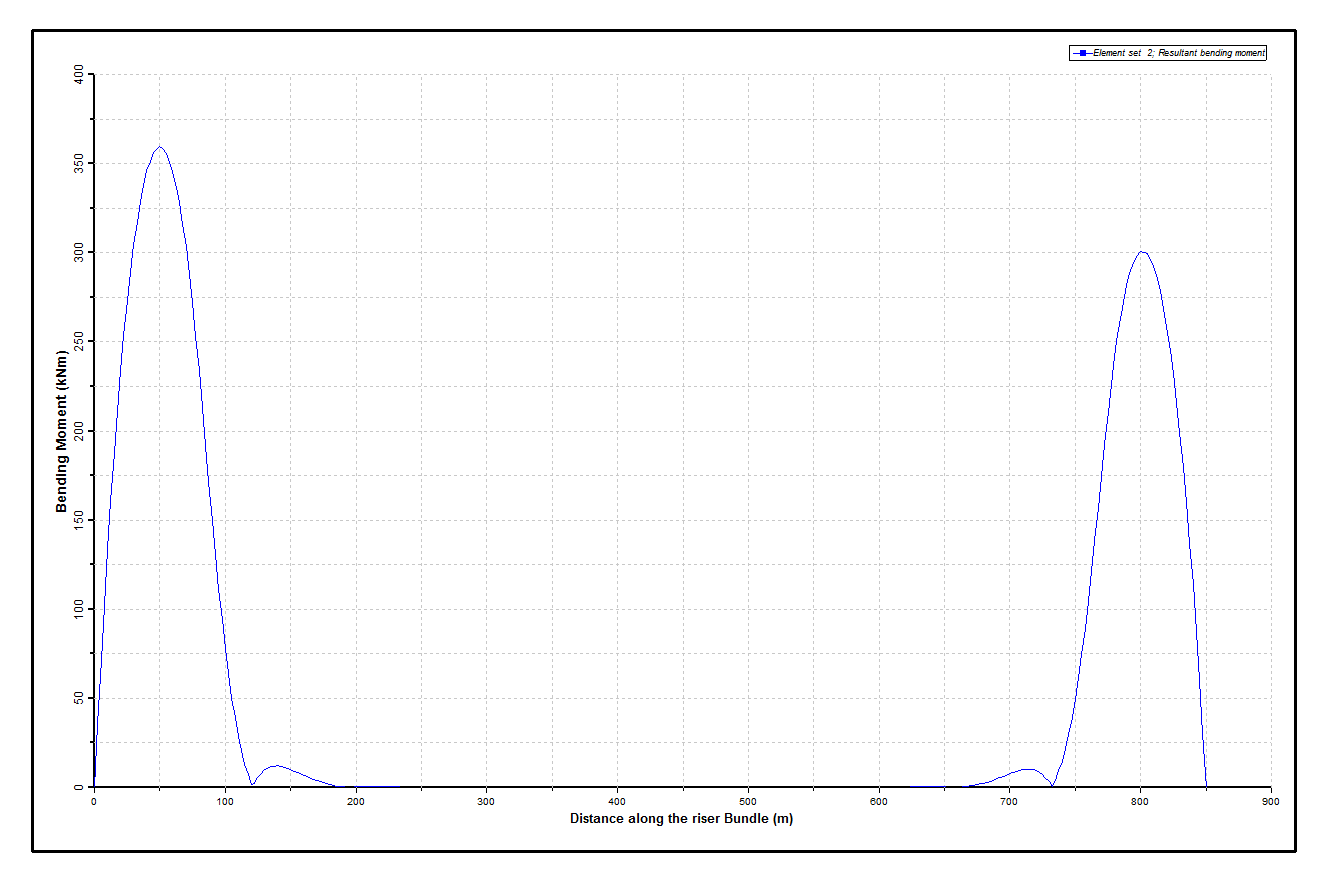
Bending Moments during Installation
The figure below shows envelopes of bending moment during the first dynamic analysis. The maximum bending moment experienced by the riser bundle during the upending process is approximately 1250kNm.
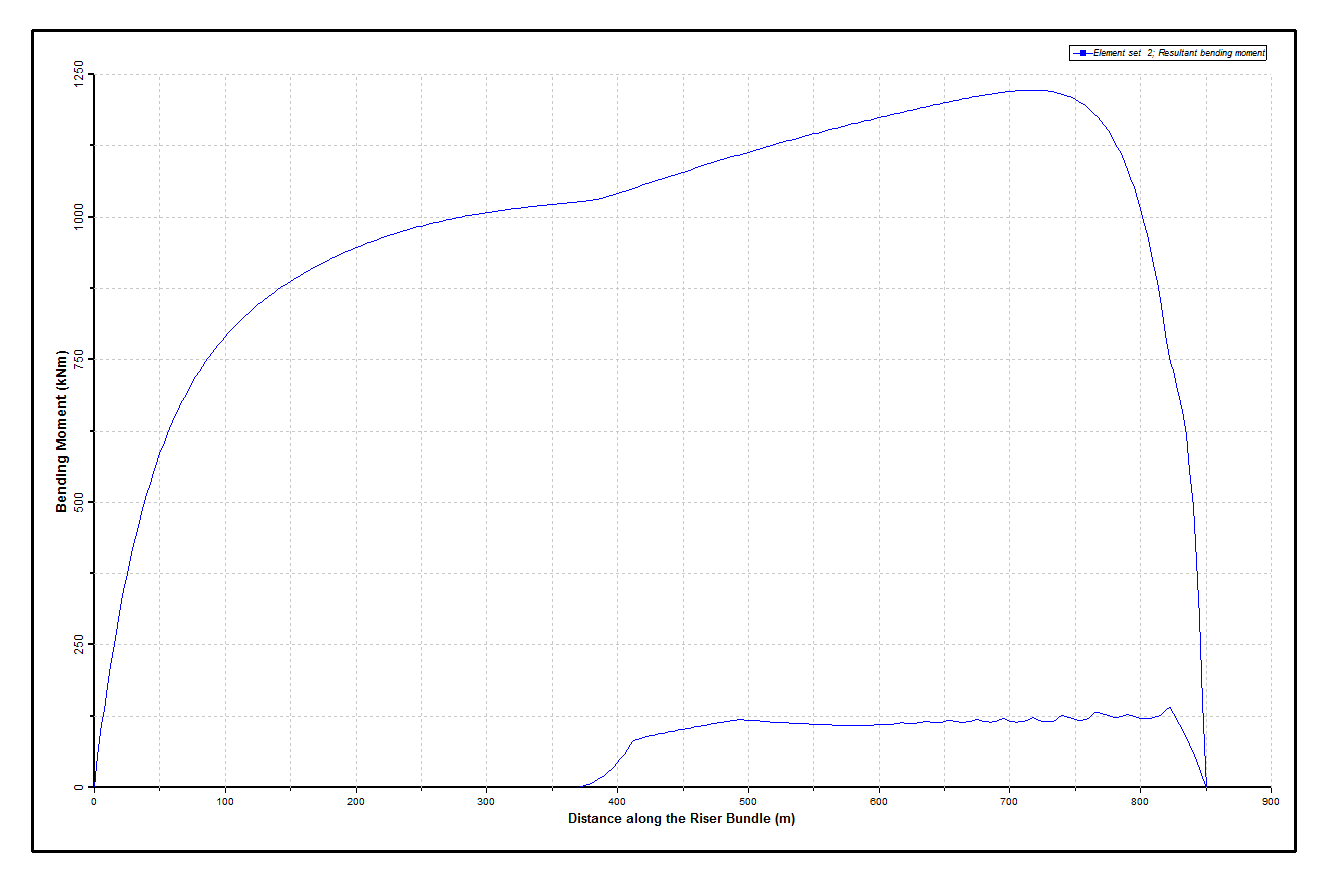
Dynamic Bending Moments
The figure below compares timetrace plots of effective tension in the rear and lead tug cables. The tension in both cables is greatest at the beginning of the dynamic analyses, because most of the bundle is floating at MWL: there is little uplift due to buoyancy, and the full weight of the anchor is borne by the cables. The tension in both cables decreases sharply as cable is paid-out from the lead tug and the foremost portion of the bundle becomes submerged. The tension continues to decrease steadily in the lead cable as the anchor and bundle weight is transferred to the rear cable. For a brief period at approximately 1720s simulation time, which is the transition period between lead tug cable winch out and rear cable winch in, the distance between the tugs continues to reduce, and the lead cable tension increases and the rear cable tension reduces temporarily. This effect is again evident towards the end of the first dynamic analysis, as the tug vessels continue to close together in the absence of winching. The lead cable tension reduces steadily as the upending procedure approaches completion, with the rear cable tension conversely increasing over the same period.
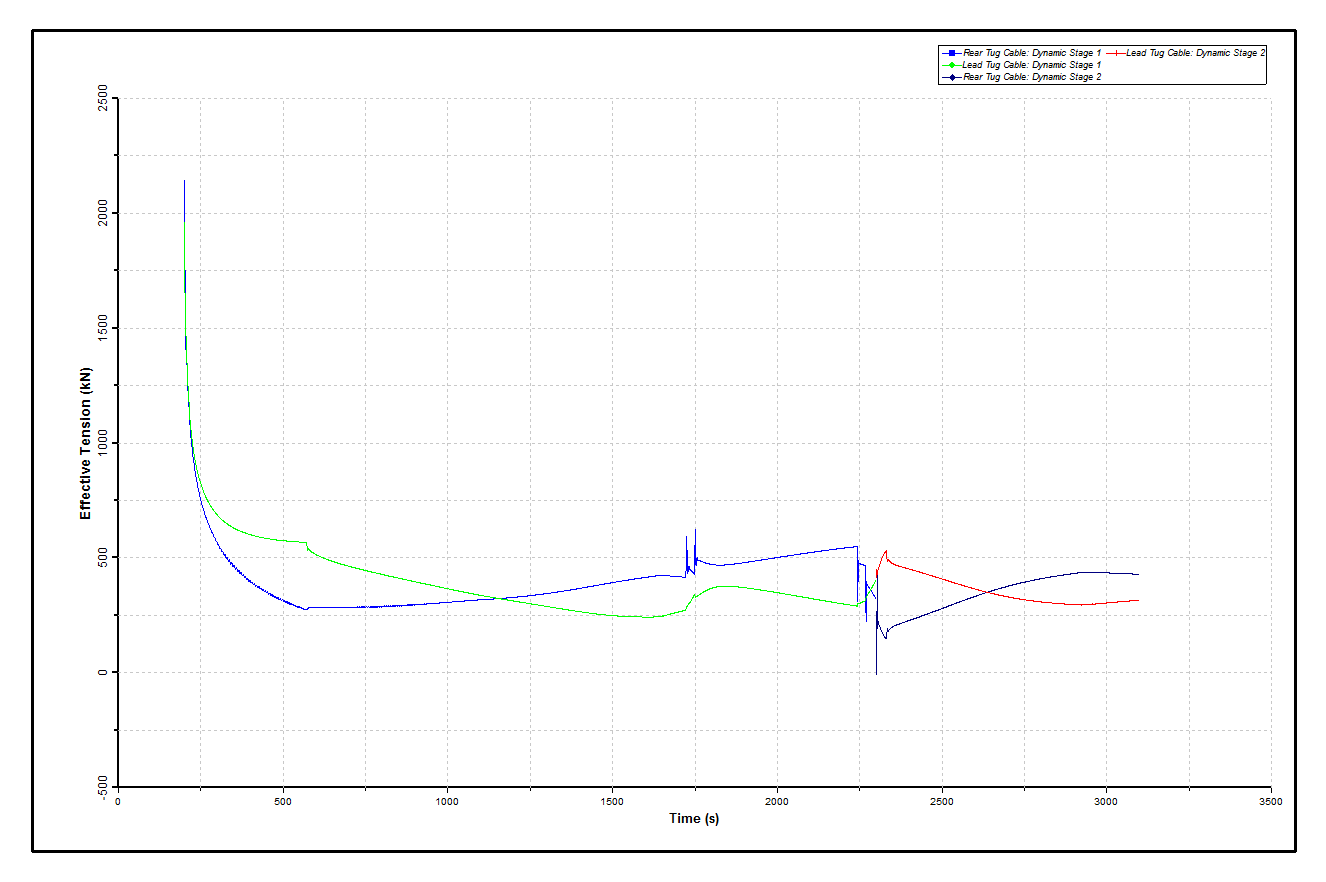
Winching Cable Tensions