Results |
 
|
Results |
|
Results from the current analysis are presented in the figures below. The first figure shows a plot of the effective tension distribution in the pipeline, the second figure shows the static bending moments in the pipeline, while the third figure shows a plot of the static curvature distribution in the pipeline.
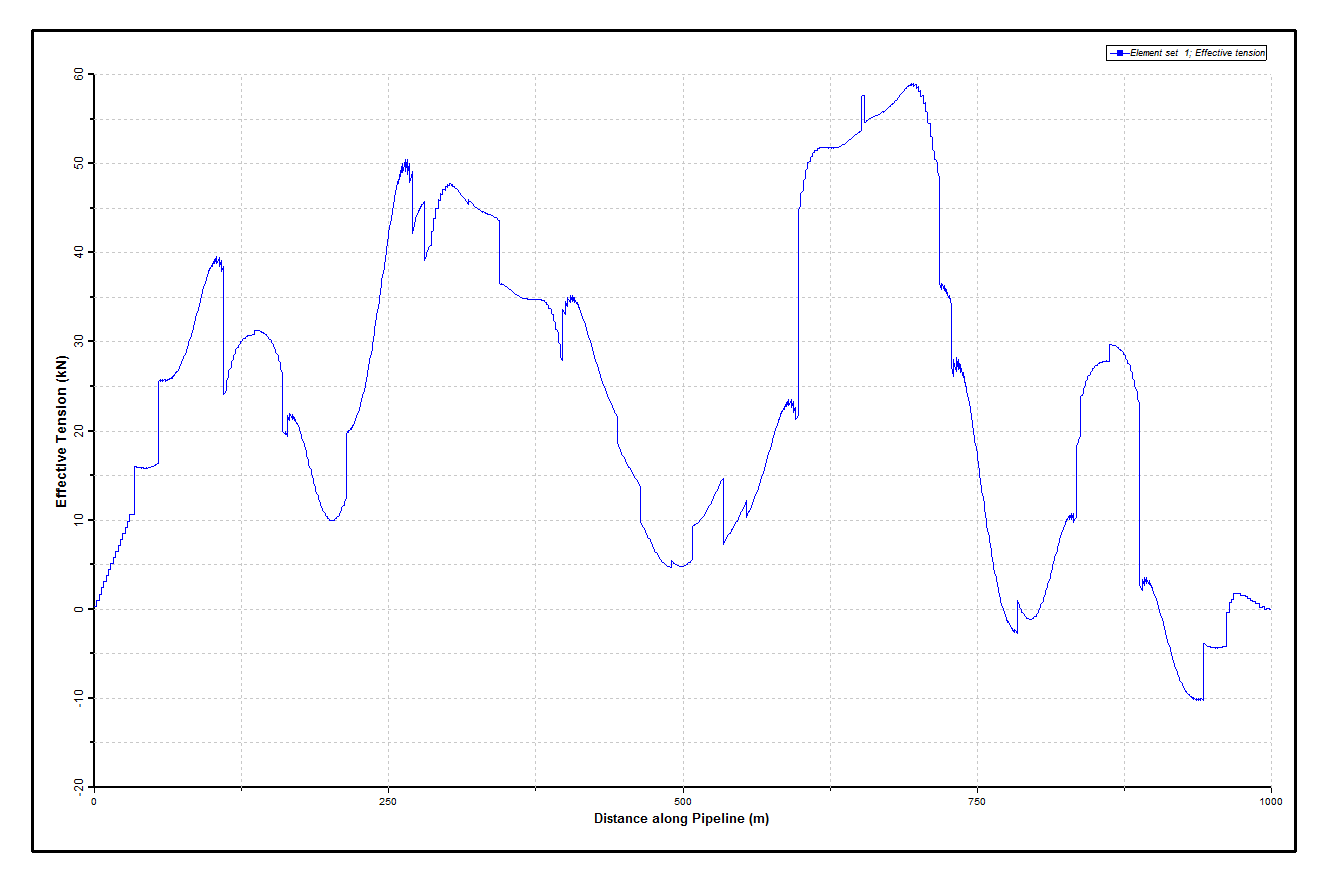
Static Effective Tension Distribution
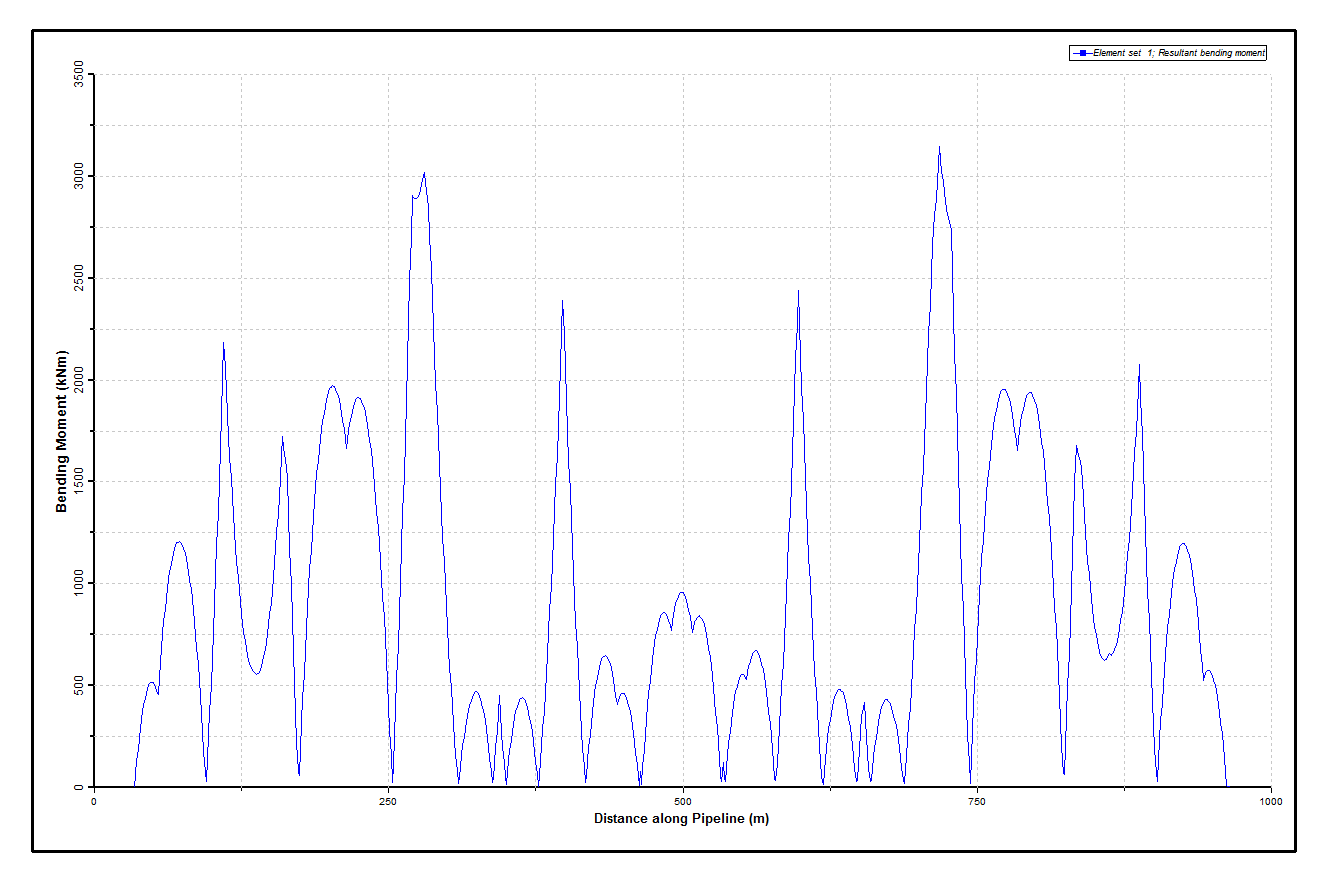
Static Bending Moment Distribution
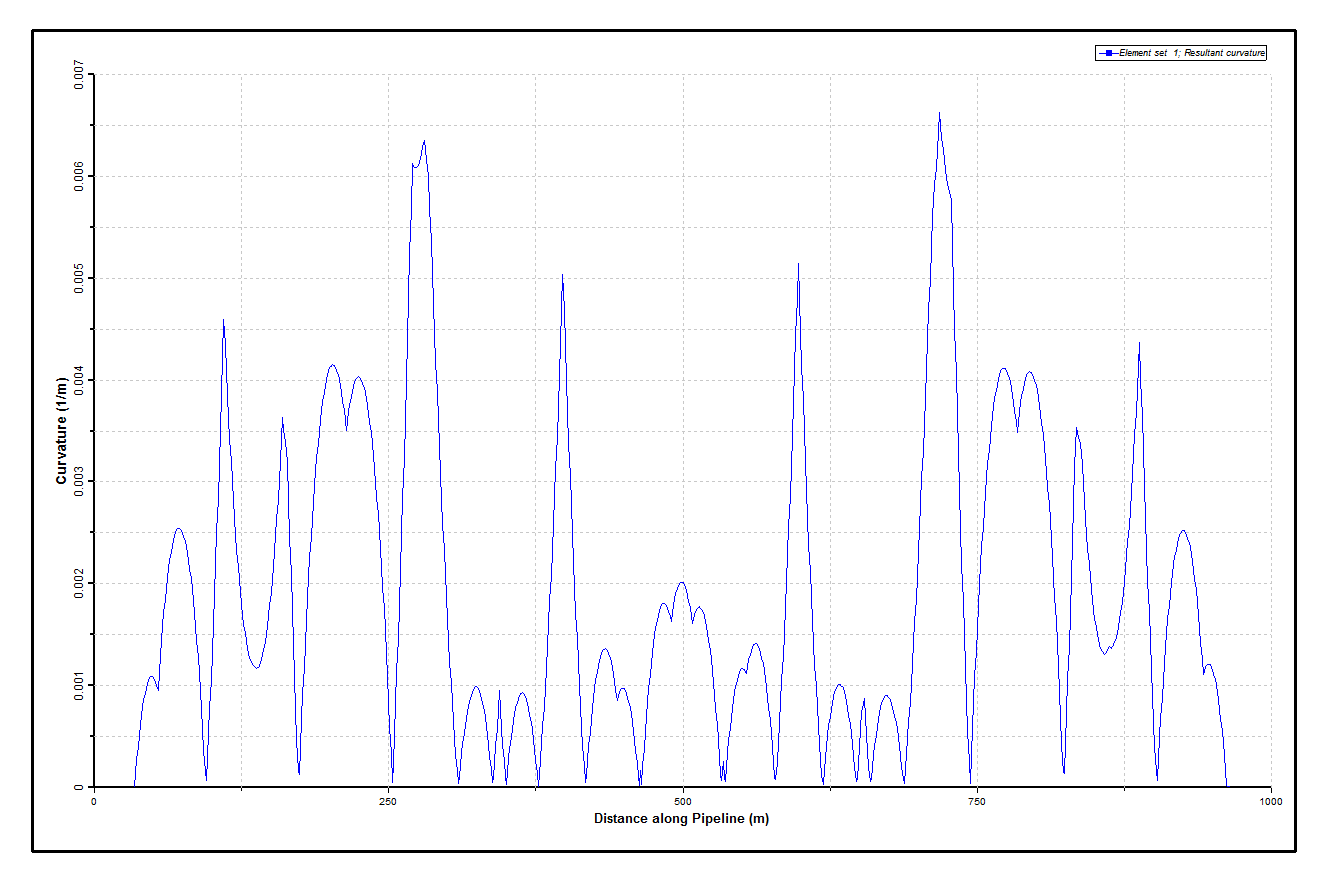
Static Curvature Distribution
Results from the dynamic analysis are presented in the figures below. The first figure shows an envelope of motion in the global Z-direction, that is, in the wave direction, transverse to the initial plane of the pipeline. The second figure shows an envelope of effective tension. Note that both plots are generated over the last three wave periods.
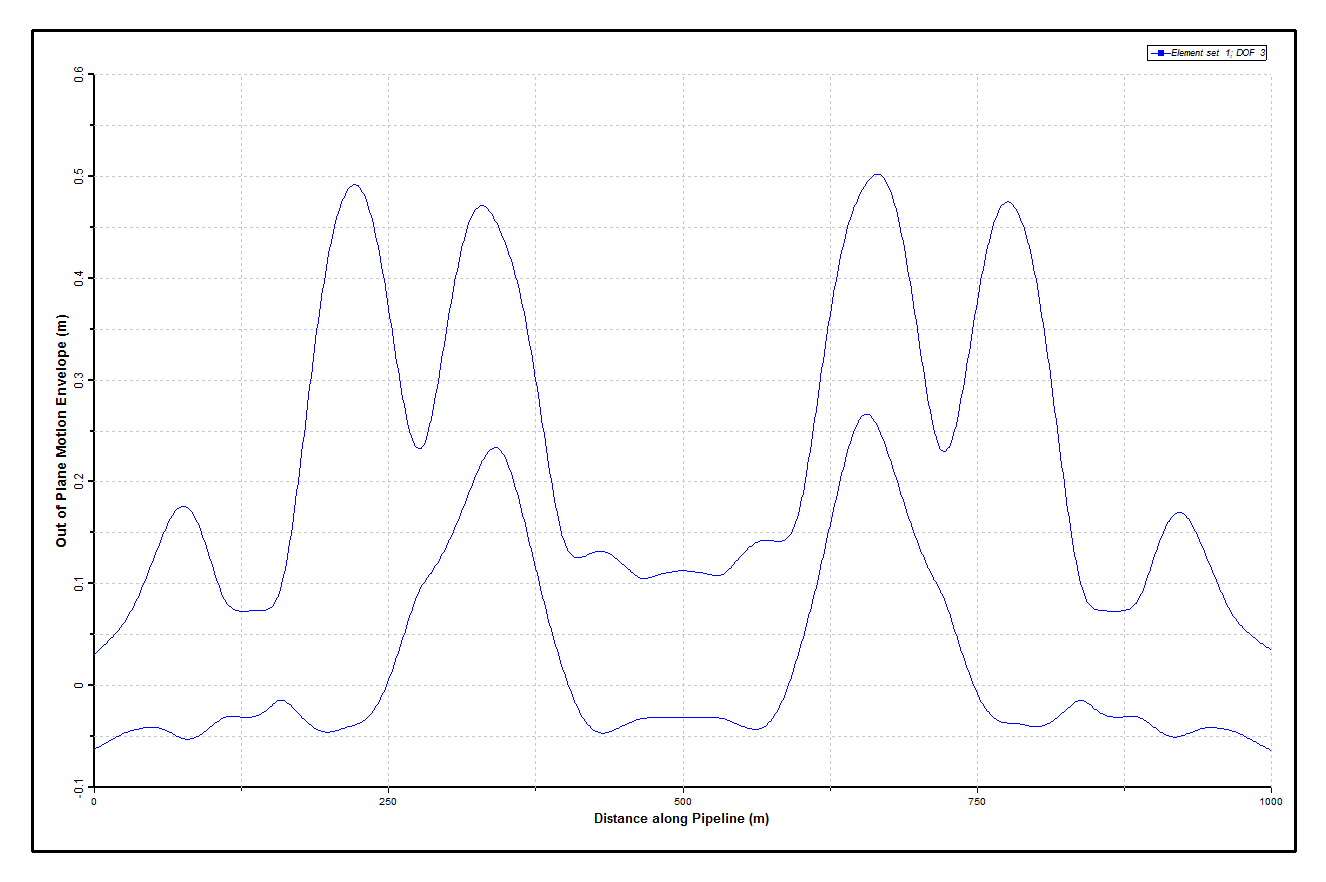
Horizontal Z-Motion Envelope
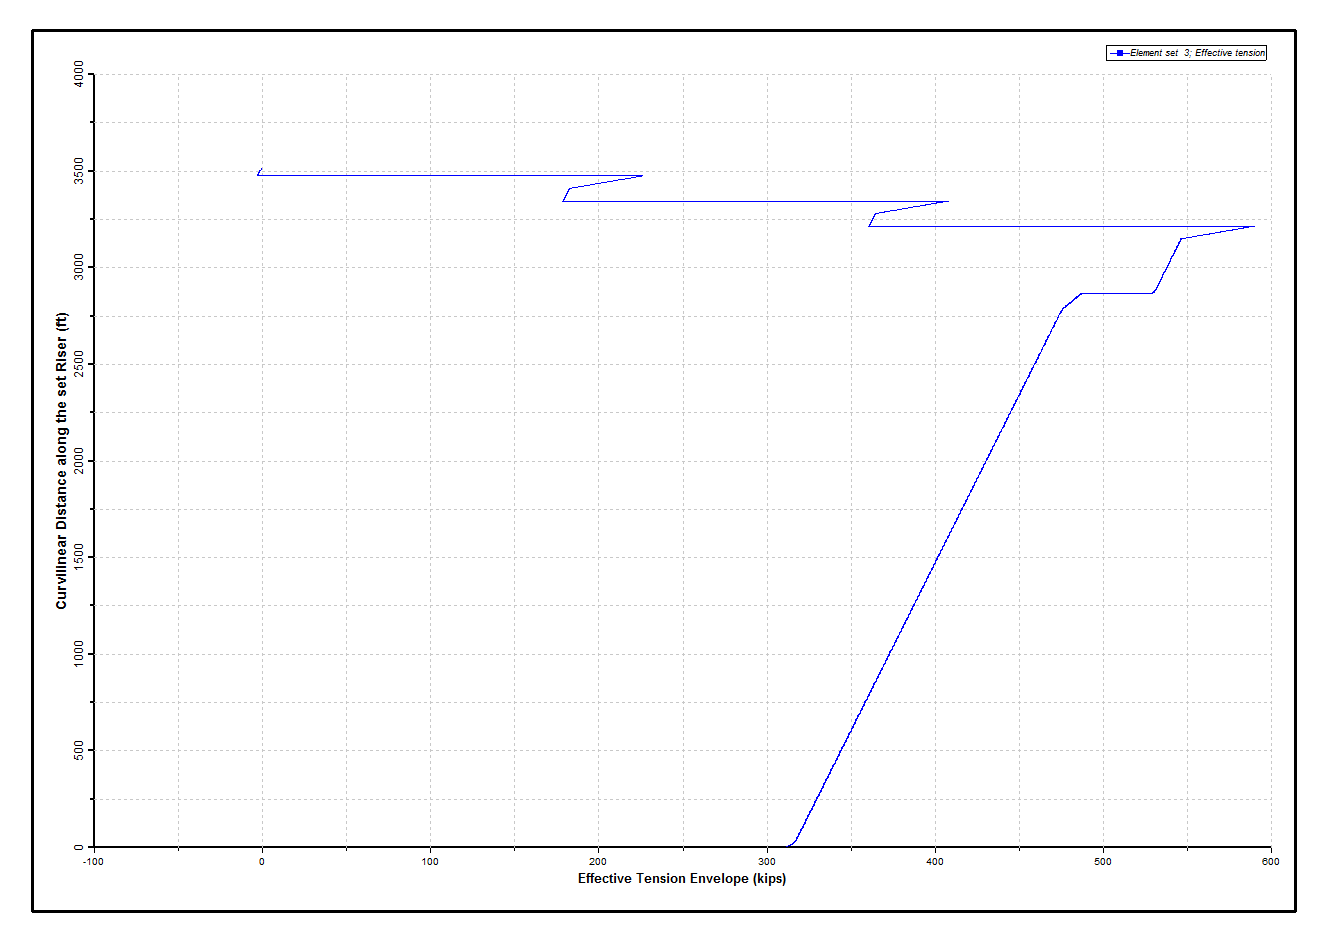
Effective Tension Envelope